Dow Jones analysis TP hitUs30 sell analysis got TP hit instant with 150 pips
1:1 RR got TP
It's in the news time happened yesterday
Us30 buy side analysis also got 180 pips before In this chart
Market indices

BANKEX S/R for 7/6/24Support and Resistance Levels: In technical analysis, support and resistance levels are significant price levels where buying or selling interest tends to be strong. They are identified based on previous price levels where the price has shown a tendency to reverse or find support.
Support levels are represented by the green line and green shade, indicating areas where buying interest may emerge to prevent further price decline.
Resistance levels are represented by the red line and red shade, indicating areas where selling pressure may arise to prevent further price increases. Traders often consider these levels as potential buying or selling opportunities.
Breakouts: Breakouts occur when the price convincingly moves above a resistance level (red shade) or below a support level (green shade). A bullish breakout above resistance suggests the potential for further price increases, while a bearish breakout below support suggests the potential for further price declines. Traders pay attention to these breakout signals as they may indicate the start of a new trend or significant price movement.
Disclosure: I am not SEBI registered. The information provided here is for learning purposes only and should not be interpreted as financial advice. It is important to consult with a qualified financial advisor before making any investment decisions. Tweets neither advice nor endorsement.

SENSEX S/R for 7/6/24Support and Resistance Levels: In technical analysis, support and resistance levels are significant price levels where buying or selling interest tends to be strong. They are identified based on previous price levels where the price has shown a tendency to reverse or find support.
Support levels are represented by the green line and green shade, indicating areas where buying interest may emerge to prevent further price decline.
Resistance levels are represented by the red line and red shade, indicating areas where selling pressure may arise to prevent further price increases. Traders often consider these levels as potential buying or selling opportunities.
Breakouts: Breakouts occur when the price convincingly moves above a resistance level (red shade) or below a support level (green shade). A bullish breakout above resistance suggests the potential for further price increases, while a bearish breakout below support suggests the potential for further price declines. Traders pay attention to these breakout signals as they may indicate the start of a new trend or significant price movement.
Disclosure: I am not SEBI registered. The information provided here is for learning purposes only and should not be interpreted as financial advice. It is important to consult with a qualified financial advisor before making any investment decisions. Tweets neither advice nor endorsement.

FIN NIFTY S/R for 7/6/24Support and Resistance Levels: In technical analysis, support and resistance levels are significant price levels where buying or selling interest tends to be strong. They are identified based on previous price levels where the price has shown a tendency to reverse or find support.
Support levels are represented by the green line and green shade, indicating areas where buying interest may emerge to prevent further price decline.
Resistance levels are represented by the red line and red shade, indicating areas where selling pressure may arise to prevent further price increases. Traders often consider these levels as potential buying or selling opportunities.
Breakouts: Breakouts occur when the price convincingly moves above a resistance level (red shade) or below a support level (green shade). A bullish breakout above resistance suggests the potential for further price increases, while a bearish breakout below support suggests the potential for further price declines. Traders pay attention to these breakout signals as they may indicate the start of a new trend or significant price movement.
Disclosure: I am not SEBI registered. The information provided here is for learning purposes only and should not be interpreted as financial advice. It is important to consult with a qualified financial advisor before making any investment decisions. Tweets neither advice nor endorsement.

BANK NIFTY S/R for 7/6/24Support and Resistance Levels: In technical analysis, support and resistance levels are significant price levels where buying or selling interest tends to be strong. They are identified based on previous price levels where the price has shown a tendency to reverse or find support.
Support levels are represented by the green line and green shade, indicating areas where buying interest may emerge to prevent further price decline.
Resistance levels are represented by the red line and red shade, indicating areas where selling pressure may arise to prevent further price increases. Traders often consider these levels as potential buying or selling opportunities.
Breakouts: Breakouts occur when the price convincingly moves above a resistance level (red shade) or below a support level (green shade). A bullish breakout above resistance suggests the potential for further price increases, while a bearish breakout below support suggests the potential for further price declines. Traders pay attention to these breakout signals as they may indicate the start of a new trend or significant price movement.
Disclosure: I am not SEBI registered. The information provided here is for learning purposes only and should not be interpreted as financial advice. It is important to consult with a qualified financial advisor before making any investment decisions. Tweets neither advice nor endorsement.

NIFTY S/R for 7/6/24Support and Resistance Levels: In technical analysis, support and resistance levels are significant price levels where buying or selling interest tends to be strong. They are identified based on previous price levels where the price has shown a tendency to reverse or find support.
Support levels are represented by the green line and green shade, indicating areas where buying interest may emerge to prevent further price decline.
Resistance levels are represented by the red line and red shade, indicating areas where selling pressure may arise to prevent further price increases. Traders often consider these levels as potential buying or selling opportunities.
Breakouts: Breakouts occur when the price convincingly moves above a resistance level (red shade) or below a support level (green shade). A bullish breakout above resistance suggests the potential for further price increases, while a bearish breakout below support suggests the potential for further price declines. Traders pay attention to these breakout signals as they may indicate the start of a new trend or significant price movement.
Disclosure: I am not SEBI registered. The information provided here is for learning purposes only and should not be interpreted as financial advice. It is important to consult with a qualified financial advisor before making any investment decisions. Tweets neither advice nor endorsement.

NASDAQ100 INDEX - 4h Technical analysisThe current short-term bullish acceleration on NASDAQ100 INDEX should quickly allow the basic trend to return to bullish. To avoid contradicting the short term, traders may prefer long positions (at the time of purchase) as long as the price remains well above 18,433.66 USD. Short-term buyers will use the resistance located at 18,677.55 USD as an objective. A bullish break in this resistance would boost the bullish momentum. The next bullish objective would then be set at 18,818.44 USD. Crossing this resistance would then open the door for buyers to target 19,062.33 USD. Caution, if there is a return to under 18,433.66 USD, it should not be forgotten that the basic trend is not yet clearly defined. Beware of against the trend sellers, many of whom will certainly benefit from this movement.

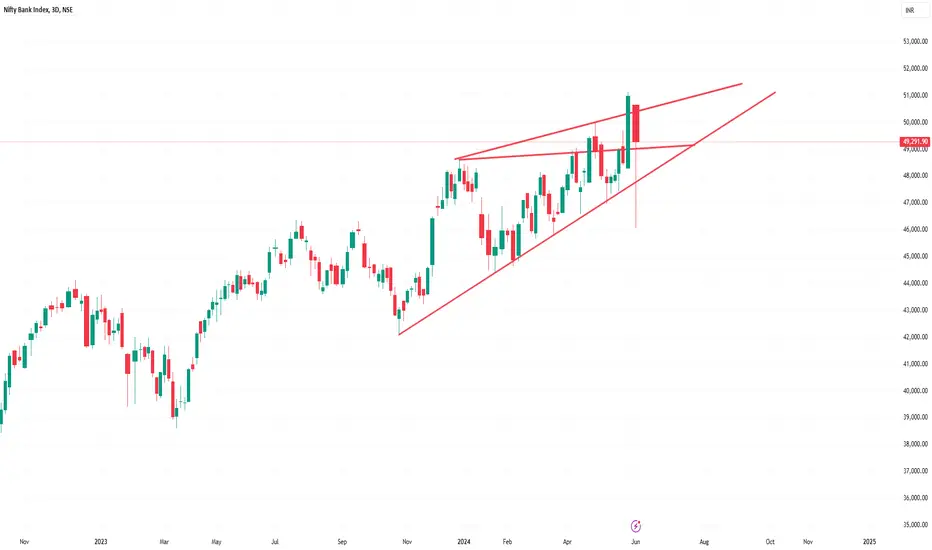
NIFTYBANK: Raining Expectations.We had the Dividend story, now the interest part comes later as part of the policy.
Interest rate cuts from the West dominated by Swiss, Canada, Danish and Europe. Russia is later in the day, and our own today.
The expectation and interest is various, 1. incoming inflation (now that the elections are over the various prices rises are expected and arguably factored too. 2. The Monsoon will be watched 3. Any pencilling of fiscal deficit and the numbers will have to wait for the actual budget to be passed.
In sum, it is narrative than the action or push a thought ready to act depending on the developments. It is happening in West, and one has to keep what East is doing. No cut and paste.
From the TA perspective, the larger damage is averted. Hence some confidence coming back.
The picture has large bullish Maribouzu. The low or open of this candle is 48300 and that is the line in sand for the bulls or bears as the case may be.
Yesterday high is the top and 48300 is the bottom is easy to pencil and work towards.
In between 48600-48900 as supports. Watch any political noise that can appear, rest assured, market would like to have a peaceful week for now than a piercing the range.
NIFTY: The Action, Cut!Turning out to be a week of action, one can read it as weak, if you have not expected this much drama from the market.
It all happens and happening in front of us. Camera, Action and Cut.
When it comes to cut, it started with Swiss, added the Candy (Candian Cut), followed by a Danish and topped with Euro Cut. Season of cuts? extrapolation to US?
Remember, in Currency markets it is relative real rates and growth that drives them; hence dollar remains range as part of the larger corrective pattern before the next leg higher. These cuts if any helped the precious metals to move higher or start their next leg higher.
Our own policy rates later in the day though nothing is expected, markets would like to see the presser.
Globally Canada data continues to deteriorate, while Euro on expected downhill, US having its own mixed data that does not suggest any rush to cuts.
Recall BOC comments, easy monetary conditions, allow restrictive fiscal policy measures, watch for more such focus shifting from monetary to fiscal as part of the adjustment.
From the TA Perspective, picked three parts of the larger move of the wedge, first one, move past the 0.786% (the rise and fall largely respected with this channel. Second too, hit 0.786 (plus near 1%). The current one is ferocious, the excess on the top, takes the excess on the bottom too.
We have hit yesterday the 0.786% hence that is the cap for this move. While this holds (one can push little over the 23050 area), and expect a slow griding down, first towards the 22630 and then towards 22380-22230 area.
Reasonable Risk Reward for the shorts here with the above stops and expectation. In-tra week harami pattern, and the PIP graph which is weekly is bearish meeting candle (even if we close near 23000), coming after dark cloud pattern. (ignoring the large wick of the meeting candle)
Supports 22765-22720-22680
Supply 22880-22930-22980

Bullish Momentum Persists Despite NAS100 Selling PressureHello Everyone,
Once more, we've achieved our target for NAS100! Despite witnessing substantial selling pressure, the prevailing outlook remains bullish, indicating an enduring positive sentiment.
TradeWithTheTrend3344

DAX going to test a monthly tls originated in March'2000DAX is following the monthly triangle pattern now going to test the higher pattern linen(Tl) so a resistance level for the time being, it depends upon how market reacts here as it is a rising tl ( dynamic) so new and higher level every month
will post possible monthly and weekly levels in the comment section

6% drop in Nifty is a buying opportunity Few followers panicked when the Nifty had a sudden drop of 6-8% within the day and caused panic and some of the late buyers were caught off guard or get margin calls............
I had said before, when you buy an index , it is a basket of blue chips companies in the respective country represented by different sectors. So , you got margin of safety in terms of sectoral diversification. Unless the entire market crash , then from a weekly, daily chart perspective, it is still riding on a bullish trend.
You can see how quickly it falls through the channel and yesterday, it has recovered more than 60-70% of the previous fall. So, I don't understand, what is the panic all about ?
As a trend follower, there is nothing to do except ride the trend until it changes.......

Bye Bye DollarShort term uptrend broken. Is heading to the uptrend line from Jan 2022, and I think it can break it down. I'm already short in Dollar against AUD and GBP and I have been adding. And I will add even more. To make it even worst for the Dollar the index broke down the uptrend with a HS. I don't need another trade to close out the year. This is the one, all in. I won't close my positions until it reaches my target.

Will Nasdaq repeat a measured moveFrom the look of things Nasdaq might just be heading to complete a second leg of a simple measured move.... which will plunge into the 20,000 levels

NIFTY Long IdeaNIFTY long idea:
My Indicator is flashing buy on NIFTY.
After a huge selling due to election results in india, NIFTY seem to recovering. Looks ready for more up side from here
Entry, SL and TP Levels are marked on chart

SPX - Mini Futures Given it's all markets factored in - not sure if tech analysis works here but..
Fib extension right? Keep it simple. Quick look at fib extension and levels look respected given support resistance.

Three methods falling! 4hr anyway… Three falling methods spotted on the dollar… this is a continuation pattern (downside in this case). Notice the three candles green completely encapsulated bu the two red candles equal to height of the three green? Booyah

US30, wave 5 should start now towards 42kLooking at US30 we have a high probability of turning into bullish again.
RSI long signal
Strong daily support
Bullish Engulfing candle
Possible wave 4 low
I expect new ATH to be build soon

US500, support confluence could built bullish momentumWe have a nice confluence of 1H and 4H support at S&P.
I'm entering with a long position to potentially follow to new ATHs, if the market sentiment pick up the trend again.


SELLPRICE TO SELL BACK TO THE 50% OF THE BULLISH MONTHLY ORDER BLOCK (EVENTUALLY). shorter term and more realistic tp is 50% of the recent bullish daily candle marked on the chart.

US 30 Potential ShortHi Traders
1.Ascending channel
2.Bearish Impulse
2.Lower time frame correction structure
When we see a clear break out from the corrent structure followed by a smaller continuation correction we can expect the next bearish move

