SUDARSCHEM - Swing Long#Educational purpose only
Take long entry once closes above 766.5 stoploss 707.75
#Follow strict stoploss

The Divine Rudra Veena made of Aluminium (NALCO)Recently all the Metals are going thru a Major Rally globally with Gold leading the Chart following by Silver, Copper, Steel and now Aluminium joins the Party
National Aluminium has formed an Interesting Pattern on Daily Timeframe resembling a "Veena" Musical Instrument and apparently NALCO is ready to play a divine song :)
Price Broke out of a larger Rounding Bottom pattern above 170 and then retested the BO zone and formed a Small Rounding Bottom pattern - the structure looks like a Veena
The upcoming Targets are 220, 250
Recommendation on NALCO was first given at 142 levels when it broke out of a Multi-Year (16 Years) Rounding Bottom pattern and as on date - we are holding with 35% Gain and waiting for 2x
Disclaimer:
3+ Years Teaching Experience in Stock Market - Technical Analysis, Behaviour Analysis, Advanced Patterns, Emotional Management, News based Trading...
We are NOT SEBI Registered and Our focus is NOT providing Buy/Sell Recommendations/calls. Primary Objective is to provide detailed analysis of how to review a chart, explain multi-timeframe views purely for Educational Purposes.
We strongly suggest our followers to "Learn to Ride the Tide irrespective of its Side"
*** Important *** Consult your Financial Advisors before taking any positions
If you like our detailed analysis, please do rate us with your Likes, Boost and share your comments
-Team Stocks-n-Trends

Texmaco Rail - The Choo Choo Train ready to Chug alongTexmaco Rail - One of our 1st multibagger picks recommended at 64 levels has blasted all initial targets given 116, 135, 153
It went on non-stop to reach 225 level blasting out of 9 Year Rounding Bottom Pattern on Weekly. Subsequently price started retesting journey back to the BO zone of 164 and bounced back strongly 2 Months in a Row
Target for this Monthly Rounding Bottom pattern is 305 which gives an upside of approx. 58%
On Weekly Timeframe: Price is travelling within a Parallel Channel and has completed a Bullish Continuation Pattern - 2 Black Crows and ended the week right at a Resistance level 193
Above 193 WCB - price would complete a Fresh Rounding Bottom Pattern which will take the Targets to 240, 320
Upcoming Targets: 240, 305, 320
Disclaimer:
3+ Years Teaching Experience in Stock Market - Technical Analysis, Behaviour Analysis, Advanced Patterns, Emotional Management, News based Trading...
We are NOT SEBI Registered and Our focus is NOT providing Buy/Sell Recommendations/calls. Primary Objective is to provide detailed analysis of how to review a chart, explain multi-timeframe views purely for Educational Purposes.
We strongly suggest our followers to "Learn to Ride the Tide irrespective of its Side"
*** Important *** Consult your Financial Advisors before taking any positions
If you like our detailed analysis, please do rate us with your Likes, Boost and share your comments
-Team Stocks-n-Trends

Educational Post: Trend and Valuations and Techno-Funda analysisWe have been told that market is always right and the price of the stock is always indicative of what is happening in the company, it’s balance sheets and its prospects for future. This cannot be true as the price of the stock or an index tends to trend. The trend can be upwards or the trend can be downward as seen in this chart. The trend can also be flat.
Now if the stock has tendency to ‘trend’ the trend will always have sentiments and sentiments will always try to overplay or underplay the prospect of the company. In case the trend is bullish the valuations will tend to be expensive. In case the trend is bearish there is always a possibility of undervaluing a company.
This is why an analyst needs to look at both Techincal and Fundamentals of a company. By looking at Fundamentals of the company you will understand the inherent strengths, it’s resilience ability to bounce back, ability to adapt and ability to grow. After having understood the and identified fundamentally strong company you can use technical analysis to enter the same or buy the stock with the help of Technical analysis. Thus you will be able to maximize the opportunity to make your money grow faster. Knowing Technicals will help you understand and establish when the trend is going to change, perhaps find when the stock is breaking out or breaking down.
When the trend is changing positively and the stock is breaking out you can invest, compound and stay invested and enjoy the bull run. When the trend is changing negatively you can perhaps book profit, partial profit or exit the stock before it breaks down completely.
It is said that either you learn or you die. My advice to investors whether you are a new investor or a seasoned player who has been investing for decades will be to keep yourself educated in terms of markets and its methodologies. Learning and unlearning should be a continuous process rather than depending on others and asking for tips to make money. If you buy and stay invested, you will make your money grow as much as the company or index grows. But if you can catch the trend which is a friend, catch the breakouts and breakdowns you will grow your money faster. Invest the most important commodity along with your money into the market, that is your time. To learn more about techno-Funda investing contact us and reap the benefit. Benjamin Franklin has rightly said,” Investment in knowledge pays the best returns.”
Disclaimer: Investment in stocks, derivatives and mutual funds is subject to market risks, please consult your investment advisor before taking financial decisions. The data, chart and other information provided above is for the purpose of analysis and is purely educational in nature. The names of the stocks or index levels of spot Nifty mentioned in the article are for the purpose of education and analysis only. Purpose of this article is educational. Please do not consider this as a recommendation of any sorts.


NavinFlourine - Reversal candidate?⚠️Disclaimer: We are not registered advisors. The views expressed here are merely personal opinions. Irrespective of the language used, Nothing mentioned here should be considered as advice or recommendation. Please consult with your financial advisors before making any investment decisions. Like everybody else, we too can be wrong at times ✌🏻

LTTS: Beautiful Breakout But ...The chart should give you everything you need to know. But here are some pointers for those who like to read:
- A beautiful Symmetric Triangle breakout. The support and resistance trendlines were religiously followed. Thus, making the pattern stronger.
- The consolidation period was a good 15 months. Every IT company has gone through the pain.
- We have defined support and resistance zones. The triangle breakout is good but is exactly near the Crucial resistance zone.
- A break and sustenance of it will be crucial for the future upmove.
- We have a 5000 psychological level sitting on the top as our first target
- Nifty IT is also gearing up for some long-due momentum. This should give a push.
What should we analyze next??
Have Requests, Questions, or Suggestions? Let us know in the comments below.👇
While you do that, how about a boost for some motivation🚀
⚠️Disclaimer: We are not registered advisors. The views expressed here are merely personal opinions. Irrespective of the language used, Nothing mentioned here should be considered as advice or recommendation. Please consult with your financial advisors before making any investment decisions. Like everybody else, we too can be wrong at times ✌🏻

VIP - Bad times?🎯 The chart is self-explanatory as always.
🎯 After 2.5 years of consolidation, The price broke below the 500 level.
🎯 The price is below the 50,100 and 200 DEMA & WEMA
🎯 Looks like tough times ahead?
🎯 Immediate support is marked.
What do you think of this price actin? Comment below...
⚠️Disclaimer: We are not registered advisors. The views expressed here are merely personal opinions. Irrespective of the language used, Nothing mentioned here should be considered as advice or recommendation. Please consult with your financial advisors before making any investment decisions. Like everybody else, we too can be wrong at times ✌🏻

Trading with LinesTry to understand how a stock takes support and resistance, there are many lines come to resist the price or support the price. Involve these line in your trading journey.
Regards

"M" is the new "W" - Double Decker MOIL"M"OIL - on Monthly Timeframe has formed a Flawless "W" - Double Bottom Pattern
The Multi-Year (14 years) pattern was finally broken out last month and right away the price blasted over 45% in 1 month forming a Super Strong Bullish Engulfing Candle on Monthly. 2 Targets were given earlier - 370, 507
Today - MOIL Blasted 20% UC moving past 2nd Target of 507 - ending strong at 524
Between Jan to Mar - price Retested the Double Bottom BO zone by retracing Fib 0.5 levels and the bouncing. This now has given an Additional FIB Target of 630
Our Entry was at 344 levels clocking 52% gains so far. When we reach 630, it would be 84% approx
Disclaimer:
3+ Years Teaching Experience in Stock Market - Technical Analysis, Behaviour Analysis, Advanced Patterns, Emotional Management, News based Trading...
We are NOT SEBI Registered and Our focus is NOT providing Buy/Sell Recommendations/calls. Primary Objective is to provide detailed analysis of how to review a chart, explain multi-timeframe views purely for Educational Purposes.
We strongly suggest our followers to "Learn to Ride the Tide irrespective of its Side"
*** Important *** Consult your Financial Advisors before taking any positions
If you like our detailed analysis, please do rate us with your Likes, Boost and share your comments
-Team Stocks-n-Trends

doneardonear is getting ready for big move, the accumulation can stretch up to next year, however one can buy at 100 and sell 120, in short term, above 121 good for 159,225

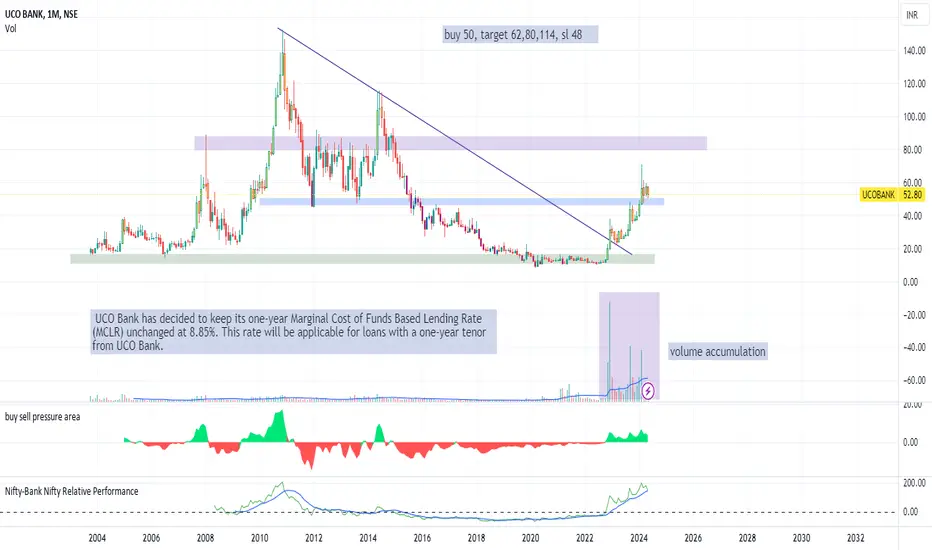
uco bankthose who missed the psu bank rallies, may buy uco bank , hold for 6 to 8 months minimum
UCO Bank has decided to keep its one-year Marginal Cost of Funds Based Lending Rate (MCLR) unchanged at 8.85%. This rate will be applicable for loans with a one-year tenor from UCO Bank.
cie automativehas completed the acquisition of a 27.89% stake in Ojaha Renewables, making it an associate company.
As part of the deal, CIE Hosur has invested 16.2 million Indian rupees to set up captive solar power generating plants with a total capacity of 4.5 megawatt peak

indus towerMSCI will add 13 Indian companies, the most among emerging markets, to the Global Standard Index from May end.
These include JSW Energy , Canara Bank (CNBK.NS), Indus Towers in the large-cap segmen

DIXON In Bullish Mode !!I really love this stock, it is looking super bullish this time, it has given a fresh breakout of triangle pattern and also above the 60SMA, RSI is too supporting strongly which is at perfect place above 64 !!

#AMBUJACEM new positionentry 619.67
SL 605
qty 25
target not defined
took small position
nicely setting up on daily tf
waiting for further signs to add more

SWING IDEA - EPLSwing retest @ Support level - 190.
Stock is trading above 200 EMA levels.
Weekly close above 190 will set the stock to next leg up.
Currently looking good at least until next S/R level if Weekly closing maintains above 190.

EMUDHRA TREND ANALYSIS (GOOD SUPPORT AREA DAILY TIME FRAME)EMUDHRA had a very good pattern in daily time frame. As per my analysis a sharp rally can be noticed in coming days.

HAPPYFORGE (inverse head & solder in daily time frame)HAPPYFORGE had a inverse head & solder pattern in daily time frame. As per my analysis a sharp rally can be noticed in coming days.

Trendline breakoutTrendline Breakout of Edelweiss above 80 on a weekly chart keep ur eyes if it closes above trendline for a target of 95 and 105 in short term

ZYDUS LIFE Weekly Chart2 year high break
Cup & Handle Formation
Support 670
RSI above 60 Daily / Weekly / Monthly

SWING IDEA - TRIDENTStock seems to be following the Trendline settings since 1 year.
Currently at Buy level again as per trendline.
Lets see how well this plays.
Expect at least 25% upside if the Trend still continues.

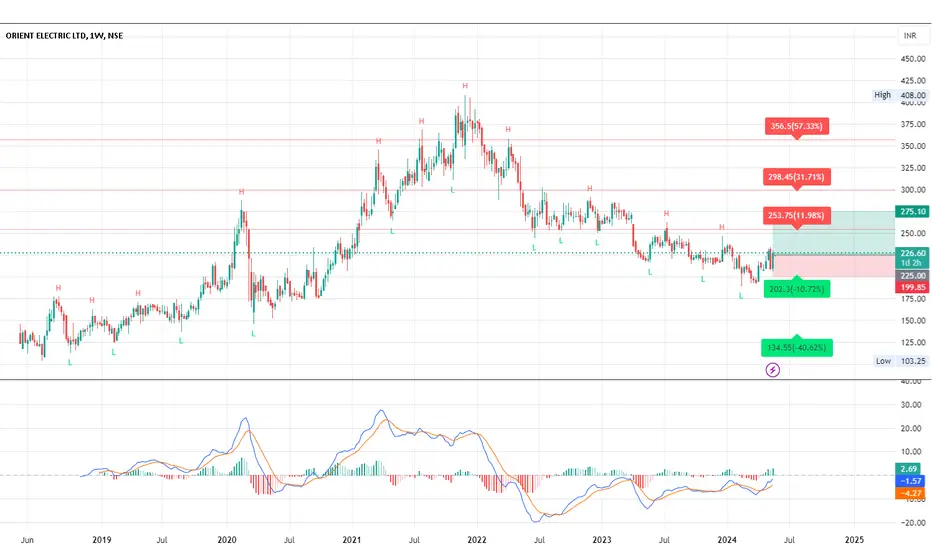
SWING IDEA - ORIENTELECPrice Action downward, however MACD taking trajectory upward.
As long as 225 levels are maintained, stock can seeing upward momentum.
Stock has also crossed 200 EMA.
Note: 225 is the key support level to start going upward. Any break or weekly close below this level will invalidate the above setup.