YARAQ1 is worse than analysts expected.
YARA is in a declining trend until proven otherwise, according to graphs.
Keep in mind, you need to do your own research and assessment before buying and selling.
Note I have a position in YARA.

NAS 250% to 50NOK - Path to 360NOKAs some of you know I have been bullish on Norwegian Air Shuttle quite for a while. I really like the stock. They bought 50 airplanes past year and are doing more passengers every year. It's weird t me the stock is trading low. - This is not financial advice, it's my thoughts on NAS!.
Congrats to investors who got on board at 7 NOK. 100% returns in stock market ar no rookie numbers. As my previous publication there was a strong support at 14 NOK which has been broken with a lot of momentum. The price traded as high as Feb 21 - 18.20NOK, and Apr 8 - 18.30NOK and formed a double top and we ar probably retesting the 14NOK for support and confirmation of bullish trend.
We just entered an enormous zone of indecision in price. Price have been very volatile between 15 and 50 with some stability at 25 NOK in Q1 2021.
With RSI oversold and MACD reversing after a strong correction past weeks, there are possibilities we are going to bull and retest 50NOK resistance. Especially with shorts under pressure and swabs/puts contract that eventually expire, I think we will look for new heights.
Bigger timeframe still bullish after recent higher high. Let's see if higher low occurs and breaks us through 18.30NOK and look for the new resistance.
Always manage your risk. Stock can keep cooling down and look for as low as 9NOK, maybe form new bigger diamond before continuation.
Do you own research. Happy trading!

NAS 100% to 15NOK - Path to 50NOKWelcome to a concise chart analysis of NAS (Norwegian Air Shuttle). I'll provide a straightforward overview. NAS is showing intriguing potential.
The NAS chart features a diamond bottom pattern. The crucial point is the robust support at 7.5 - 8 NOK, indicating a stable floor.
The Exponential MACD displays a zig-zag pattern, signaling NAS's alternating bullish and bearish momentum. Currently, it's on the verge of a potential upward shift.
Breaking the 15NOK resistance level can turn into substantial support once surpassed. Once we break 14-15 NOK, the path to 50NOK becomes a real possibility.
Do you own research. Happy trading!

Nordic Semiconductor PredictionRecent hype pushes price into resistance area, may continue downtrend and break below support to where it started uptrend during Covid.

1D TGS possible OHS and cup'n'hande pattern ahead of Q1 8. May1D TGS possible OHS and cup'n'hande pattern ahead of Q1 8. May
The following pattern is triggered
-Inverse Head And Shoulder pattern
-All Chart Pattern Last Awaiting All pattern
-Cup & Handle Final script

IDEX biometrics hit to the bottom. Where to go now?IDEX biometrics hit rock bottom. It looks like there is no way to go anymore. Company shows many colaborations.
Biometric cards are becoming popular.
In 2-3 years, it is not impossible to predict that share values will increase by 100x
If you are looking for long term solid investement, IDEX is on free fire.

1D PGS possible OHS and cup'n'hande pattern ahead of Q1 8. May1D PGS possible OHS and cup'n'hande pattern ahead of Q1 8. May
The following pattern is triggered
-Inverse Head And Shoulder pattern
-All Chart Pattern Last Awaiting All pattern
-Cup & Handle Final script

HPUR can run to the upsidePretty decent room to move.
Keep tight SL, and trailing SL when price moves upwards.

Zapotec rejects support x 3Trade idea: Price to bounce up after rejecting support for the third time.
Target: Trend Channel roof.

REC Silicon sees its rise from Moses LakeREC Silicon will soon report news about its production start at Moses Lake, leaving the stock to probably rise from the bottom of its long term box range (between 10 and 20 for years, outliers occurs).
REC Silicon have become the trading favorite at OSEBX (Oslo Stock Exchange) due to its volatility during news runs and Q-reports.
Already bumped its bottom support level twice recently on the Daily chart, and formed a double bottom pattern, trading at the neckline. Long position to get in the game.
Trade Idea: CEST
Condition: Candle to close above the trend channel roof on the Daily Chart
Entry: On re-test of the trend channel line the price just closed above
SL: 9.5
TP: 14
R/R = 2 and 27 % Profit
Note: Price might touch support before reversing to the upside, so please manage risk and entries accordingly

Is Western Bulk Chartering ($WEST) ready for some action?Dry Bulk in 2024 is on a rise, and his could be the pilot for NASDAQ:WEST , after a poor 2023 where everything went wrong and cut on dividends.

Long. TP 260. The share price has broken out after 3 years of consolidation, making new ATHs in modest increments.
Things are turning bullish for the sector, which has been in the doldrums for the last 4 years, first hit with COVID, then consumers hit with double whammy of high electricity prices and higher interest rates, following markdowns of fair values of real estate assets due to higher transaction yields driven by interest rates.
What was a nearly perfect storm of depressive events has now turned to an accumulation of bullish factors for the sector. Consumers are getting wage increases, electricity prices have come down, and interest rates appear to have peaked, with some signals materializing of potenital decreases in rates towards the end of 2024.
OLT is not the only company in the sector breaking out of a 3 year holding pattern, a similiar patter can be seen for Unibail Rodamco Westfield, and NEPI Rockastle.
All companies are showing
1. Double digit increases in like for like revenues
2. Extremely low valuations in a historic context, with earnings multiples being between 7-9x
3. Price to book values significantly below 1, with discounts to NAV of 40% of more
Low valuations, strongly improving outlook and finally, bullish technicals makes this a no-brainer. Unless Putin decides to attack Poland (GFB), the only way is up.

hydrogen come back to growththe methane price growth and electrolyze need for Europe line.
technical agree for it.

Komplett ASA bullish moveSome bold targets for Komplett ASA here, first 10.40. RSI is at a good place for a breakout, let's see how it goes.

January breakout fib tradeJanuary trade on technicals. Stop on local support trend line. Breakout from the larger wedge structure might prove interesting.

Equinor (EQNR) | Technically a Great Opporunity!Hi,
Long story short, technically the price of EQNR has started to approach an interesting price level. A lot of criteria are matching and from my point of view, those who have waiting for an opportunity to jump in then you can slowly start building your position. Obviously, after you have done your homework about fundamentals - this, what I share here, is basically pure technical. If you find something interesting from fundamentals as well then you have two green lights from both analyses and you are ready to go!
Criteria inside the marked box, starting from the highest
1. Equal waves from the top
2. Previous yearly highs starting to act as support levels (highs from 2006, 2008, 2014, 2019)
3. Fibo golden ratio 62%
4. 50% drop from the all-time high.
5. The round number 200 NOK
Hopefully, it will work as good as previous Equinor ideas:
1)
2)
Good luck,
Vaido

EQNR ELLIOTT WAVE ANALYSIS, END OF WAVE CEQNR is in the end of a C wave which will most likely be at the 335 area.
According to the Elliott wave theory, at the end of the C wave, a new move will follow in the bigger trend. First we most likely will hit the 335 area to complete a 5 way move to the level of the end of 4th wave and 1,236 length of A wave)
Then we can expect the first impulsive move towards the 380 area which will be resistance.
Trade carefully.

NELNEL at Support and divergence at the weekly timeframe.
It`s time for a bounce.
No Financial Advice.

NAS reverse head and shoulders formationNorwegian Air Shuttle (NAS) has formed a reverse head and shoulders formation, signaling a shift in dynamics between buyers and sellers in favor of buyers. Since June 2021, the outlook for NAS has been uncertain, but there has now been a significant breakthrough above a resistance level.
The range between 13.5 and 13.7 has been a significant resistance zone for NAS since June 2021. The first encounter with this resistance occurred in February 2022, followed by another attempt in april 2022. Afterward, the stock declined, forming the head in the reverse head and shoulders formation. The stock managed to recover to the resistance in June 2023 but failed to break through. Subsequently, a decline ensued, establishing the right shoulder.
On February 5, 2024, the stock successfully broke through the resistance with high volume. This suggests further upward movement and marks the beginning of a potential rising trend.

NHY 20 min chart median lines & levels for entry and exitNHY - NORSK HYDRO - 20 min
Some median levels for the down side and some upper levels for longer term. POssible entry levels for short and mid term. Currently NHY is in a down trend but a reversal may be soon ahead as it reaches levels under 60, may we see levels under 57 before reversal

Yara is in a declining trend The analysis here may be irrelevant if you are long.
Yara is in a declining trend – price < SMA50 < SMA100 < SMA200.
Double peak (DT) from around July 17 to October 19, 2023, where the object has been taken out.
Support, when looking back in time on the 5 year chart, around 335 and 310.
Oversold January 5-8 and from January 12, 2024 at RSI 7, but not RSI 14.
Oversold in the same periods at Williams%R 14.
Price momentum indicators overall on sell.
There is no good correlation between price and volume.
The stock is technically negative over the medium term — one to 6 months.
The sum of short positions is 0.00%. On 28.11.23 there was a position of 0.5% one day and from 3 to 5 July -23 a position of 0.5%. That doesn't suggest that those who shorter think there's much to be gained.
The price is in down trend as the last 3 quarters have been disappointing. Fundamental analysts are, on average, neutral on the stock. Refers to Trading View and Yahoo Finance.
NB: Remember you must do your own research and assessment before buying and selling.
NB: I have a position in Yara. I have an unrealized price loss on the stock, but it's only about half of my dividend on the stock. Consider down selling or stop loss to reduce the risk of loss.

YAR: Potential Buy AreaKey level combined with long term trend line. First target at 352 NOK. BEWARE OF THE COMING EARNINGS. The earnings always pose a surprise risk.

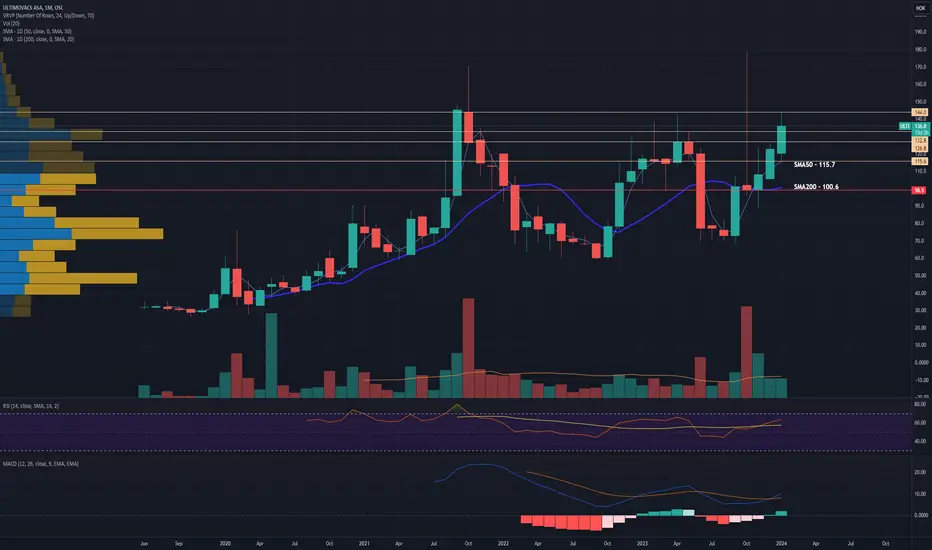
Ultimovacs finalize topline data for ph2 cancer vaccine trialUltimovacs is a norwegian clinical phase biotech with a universal cancer vaccine as its lead product.
Today the company reported to the market that in march it will share topline data from its randomized phase 2 trial INITIUM for its lead product UV1 , a universal cancer vaccine to be used in combination with checkpoint inhibitors.
The stock is at the moment testing the last major resistance level at around NOK 140, before the way is open to a retest of ATH.