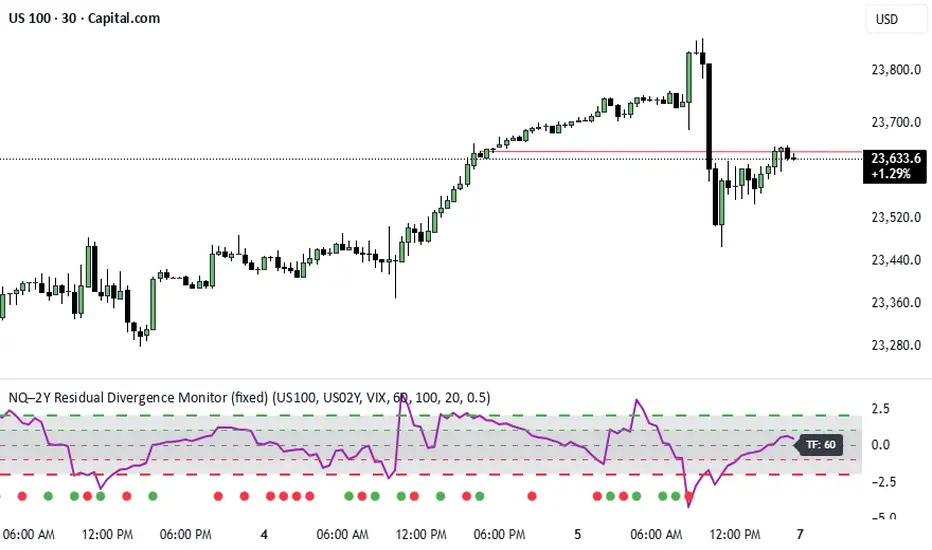
NQ–2Y CorrelationThis indicator tracks the relationship between the Nasdaq futures (NQ) and the US 2-Year Treasury yield (US02Y). The two typically move in opposite directions. This tool highlights when that relationship breaks down, and when moves become stretched to extremes. This can be useful for traders to find inflection points in price representing either overbought or oversold extremes.
Key Features
Residual Z-Score: Shows how far NQ’s returns deviate from what would be expected given moves in the 2Y. Useful for spotting stretched conditions (+/- 2σ bands).
Correlation Tracking: Fast and slow correlations between NQ and inverted 2Y returns. Helps identify regime shifts in the relationship.
Same-Direction Signals: Green dots mark when NQ and 2Y both move strongly in the same direction (rare alignment). Red dots mark strong opposing moves.
Alerts: Triggers available for residual stretches, correlation flips, and significant same-direction or opposite moves.
Usage
Monitor Z-Score to identify when the equity–rates linkage is stretched beyond typical bounds. I typically use this on the H1 or H4 timeframe.
Watch for correlation regime shifts to spot changing market dynamics. Typically price falling into support or moving into resistance as there is a false correlation or a flip.
Same-direction dots help flag unusual synchronized moves between risk assets and yields - these are especially useful for identifying false moves.
Pine Script® indicator