LBB + RSI Multi-Level + Compact TableBB and RSI scalping script for daily or scalp zone with signals
Oscillators

Momentum-Reversal System Signals Pro
Momentum-Reversal System Signals Pro
Overview
A sophisticated signaling system designed to identify high-probability trend-following entries after a price pullback. This indicator is optimized for index futures like the S&P 500 (ES/SPX) on a 5-minute timeframe .
It performs best during periods of established trends and lower volatility. To aid in this, the indicator includes a customizable "No-Trade Zone" highlighter, which is pre-set to the often volatile 8:30 AM - 11:30 AM EST market open. While the default settings are robust and effective in most conditions, the indicator is fully customizable to suit your specific trading style.
How It Works
The core logic is based on a three-step process to filter for high-quality setups:
Trend Confirmation: The script first establishes the overall market direction using an EMA on a higher timeframe (15-minute by default). This ensures you are only looking for trades that align with the dominant trend.
Pullback Detection: Once the trend is confirmed, the script waits for the price to pull back to a dynamic area of value on the main chart (5-minute by default). This "pullback zone" is defined by the 5m EMA and an ATR-based channel around it, which adapts to current market volatility.
Momentum Entry: After a valid pullback occurs, the script waits for a clear sign that momentum is returning in the direction of the primary trend. This is confirmed by a combination of a MACD crossover and a strong RSI reading, signaling that the pullback has likely ended and the trend is ready to resume.
Advanced Quality Filters
What makes this indicator powerful is its multi-layered filtering system designed to weed out low-probability signals and avoid choppy market conditions.
Trend Strength: It doesn't just check the trend direction; it measures the slope of the 15m EMA to ensure the trend has sufficient strength. This is a key filter for avoiding flat, sideways markets.
Momentum Confirmation: An RSI "Dead Zone" around the 50-level ensures that the RSI shows decisive momentum before a signal is generated.
Signal Cooldown: A built-in timer ( Min Bars Between Signals ) prevents the same signal from firing repeatedly in a short period, reducing noise and over-trading.
RSI Volatility: The script checks that the RSI itself is not flat, which is often a sign of market indecision and a precursor to chop.
Pullback Quality: An optional filter ensures that by the time the signal fires, the price has already moved back to the "correct" side of the 5m EMA, confirming the reversal's strength.
Volatility Filter: A crucial risk management filter that blocks signals on abnormally large, high-risk "gasoline" bars that could lead to immediate stops.
How To Use
For Long Signals (Green 'Long' Tag):
Look for the 15m EMA to be green and trending upwards.
Wait for price to pull back towards the orange 5m EMA.
A "Long" signal appears when momentum indicators confirm a reversal back in the direction of the trend.
For Short Signals (Red 'Short' Tag):
Look for the 15m EMA to be red and trending downwards.
Wait for price to pull back towards the orange 5m EMA.
A "Short" signal appears when momentum indicators confirm a reversal back in the direction of the trend.
This tool provides high-probability signals, not guarantees. It is designed to be a core component of a complete trading plan. Always use proper risk management and confluence from your own analysis.
Fine-Tuning & Customization
All settings are fully adjustable in the script's "Inputs" tab to match your risk tolerance and market conditions.
Timeframe & EMA Settings: Adjust the core moving averages that define the trend and pullback zones.
Pullback Settings: Define what constitutes a valid pullback by adjusting the lookback period and the size of the ATR-based "near" zone.
Quality Filters: This is the most important section for tailoring the script's strictness. Increase the EMA Slope, RSI Dead Zone, or Signal Cooldown to receive fewer but potentially higher-quality signals.
Advanced Filters: Enable or disable the Pullback Quality and Volatility filters for an extra layer of confirmation or risk management.
No-Trade Zone Highlighter: Adjust the session and timezone to highlight periods you wish to avoid, such as news events or low-liquidity hours.
Happy trading, and please use this tool responsibly.

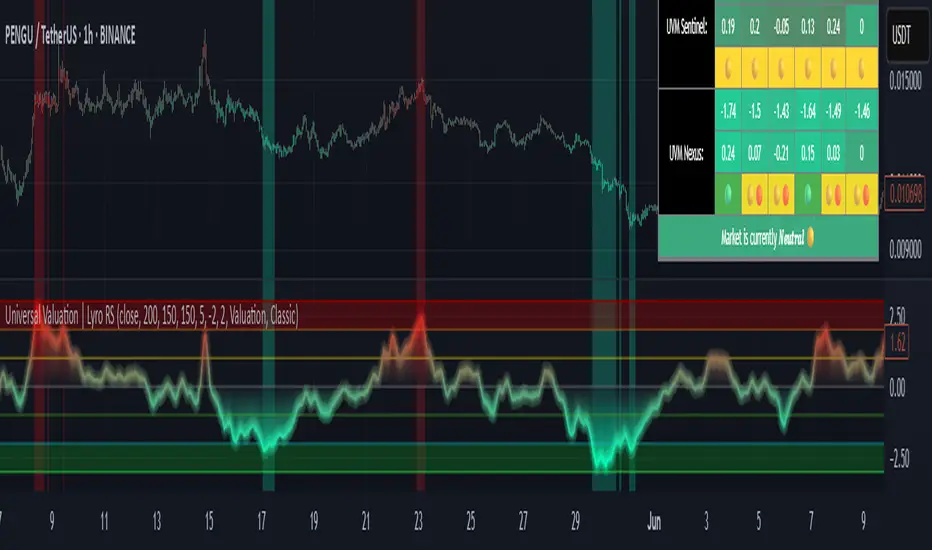
Universal Valuation | Lyro RSUniversal Valuation
⚠️Disclaimer: This indicator is a tool for technical analysis and does not provide guaranteed results. It should be used in conjunction with other analysis methods and proper risk management practices. The creators of this indicator are not responsible for any financial decisions made based on its signals.
Overview
The Universal Valuation indicator helps identify whether the market is undervalued/cheap or overvalued/expensive. And another mode this indicator offers is This cutting-edge tool works flawlessly ACROSS ALL TIMEFRAMES & TICKERS/CHARTS.
By combining regular TradingView indicators & some of our valuation indicators basic/simple with advanced statistical functions, this indicator offers a powerful, universal valuation tool.
Key Features
INPUTS: The Universal Valuation indicator offers flexibility through its customizable input sections. The "Indicator Settings" let you adjust lengths for the raw indicators and statistical functions. The "Signals" section defines thresholds for background color changes, helping you visually spot key market moments. The "Colors" section allows you to pick from pre-defined schemes or personalize colors for better clarity. Lastly, the "Tables" section gives you full control over the UV table’s size and positioning, including options to overlay it on the chart or place it in the allocated space.
A DEEPER INSIGHT: This indicator is built around three distinct categories: "UVM Andromeda," "UVM Sentinel," and "UVM Nexus." Each category has three different drivers. The statistical function powering this indicator is the Z-score. The Z-score is an incredibly powerful tool that helps determine if the market is overvalued/expensive or undervalued/cheap, offering critical insights for traders."
Plotting: The plotted value represents the average of all the drivers. In other words, it is the combined average of all 9 Z-scored indicators, providing a balanced and comprehensive market valuation.
What is Z-score? & Why does this system use it?
Z-score is an advanced statistical function used to measure how far a value deviates from the average in a data set. The formula for Z-score is: (x - h) / o, where x is the observed value, h is the average (mean) of the data set, and o is the standard deviation.
This system uses the Z-score because it helps determine whether the market is overvalued or undervalued based on historical data and how we apply the calculation. By measuring how far a value deviates from the average, the Z-score provides a clearer and more objective valuation of market conditions. In our case, a Z-score of -3 indicates an undervalued market, while a Z-score of 3 signals an overvalued market.
UVM Andromeda:
UVM stands for Universal Valuation Model, which is the core of this indicator. Andromeda, one of the most stunning galaxies in the universe, inspired by its name. We chose this name because a powerful indicator should not only be effective but also visually appealing.
You might be wondering what drives UVM Andromeda. The three key drivers are Price, RSI, and ROC. These indicators are pre-defined, while the "Indicator Settings" allow you to adjust the length of the Z-score calculation, refining how the model analyzes market conditions.
UVM Sentinel:
Sentinel, refers to a guard or watchman, someone or something that keeps watch and provides protection. In our case this name refers to a model that actively observes market conditions, acting as a vigilant tool that signals important shifts in valuation.
Wondering what drives UVM Sentinel? The three key drivers are BB%, CCI, and Crosby. While these indicators are simple on their own, applying our Z-score function elevates them to a whole new level, enhancing their ability to detect market conditions with greater accuracy.
UVM Nexus:
We chose the name Nexus simply because it sounds cool—there’s no deeper meaning behind it for us. However, the word itself does have a meaning; it refers to a connection or link between multiple things.
The three key drivers for UVM Nexus are the Sharpe, Sortino, and Omega ratios. These are all asset performance metrics, but by applying the Z-score, we transform them into powerful valuation indicators/drivers, giving you a deeper insight into market conditions.
Why do we use 9 different indicators instead of 1?
That's a great question, and the answer is quite simple. Think of it like this: if you have one super soldier, and they miss a shot, it’s game over. But if you have many soldiers, even if one misses, the others can step in and take the shot. The strength of using multiple indicators lies in their collective power – if one misses, the others still provide valuable insights, making the overall system more reliable.
Final Thoughts:
In our Universal Valuation indicator, you have the flexibility to customize it however you like using our inputs. The system is divided into three distinct categories, with each category containing three indicators. The value plotted on the chart is the average of all nine indicators. We apply the Z-score, an advanced statistical function, to each of these nine indicators. The final plotted average is the average of all the Z-scores, giving you a comprehensive and refined market valuation. This indicator can work on any timeframe & chart ticker.
Apex Edge - RSI Trend LinesThe Apex Edge - RSI Trend Lines indicator is a precision tool that automatically draws real-time trendlines on the RSI oscillator using confirmed pivot highs and lows. These dynamic trendlines track RSI structure in motion, helping you anticipate breakout zones, reversals, and hidden divergences.
Every time a new pivot forms, the indicator automatically re-draws the RSI trendline between the two most recent pivots — giving you an always-current view of momentum structure. You’ll instantly see when RSI begins compressing or expanding, long before price reacts.
Key Features: • Dynamic RSI trendlines drawn from the last 2 pivots
• Auto re-draws in real-time as new pivots form
• Optional "Full Extend" or "Pivot Only" modes
• Slope color-coded: green = support, red = resistance
• Built-in dotted RSI levels (30/70 default)
• Alert conditions for RSI trendline breakout signals
• Ideal for spotting divergence, compression, and early SMC confluence
This is not your average RSI — it’s a fully reactive momentum edge overlay designed to give you clarity, structure, and timing from within the oscillator itself. Perfect for traders using Smart Money Concepts, divergence setups, or algorithmic trend tracking.
⚔️ Built for precision. Built for edge. Built for Apex.

2EZ-UA-SS🔹 2EZ-UA-SS – Ultimate Swing Scalps
The precision-engineered scalping tool for fast, high-conviction trades.
2EZ-UA-SS is your tactical advantage on short timeframes. Whether you’re scalping crypto, FX, or indices, this algorithm is purpose-built for accuracy and timing. Designed with a multi-layered logic engine, SS filters out noise and only shows trade setups when elite-level confluence is reached.
Core Features:
✅ Kalman Filter Smoothing: Tracks real-time market flow with adaptive sensitivity
✅ Gaussian Filter: Refines signals to eliminate short-term chop
✅ MACD Flip Logic: Highlights early momentum shifts
✅ Heikin Ashi SuperTrend: Validates higher timeframe directional bias
✅ ZLEMA Confirmation: Ensures entry is in sync with core trend
✅ Alternating Signal Logic: Prevents double signals and overexposure
✅ ATR-Based TP & SL Targets: Automatically visualized with live labels for risk-managed trades
✅ Beginner/Advanced Modes: Toggle to see simplified entries or full confluence stack
When to Use:
Fast-paced scalping (1m–5m timeframes)
Volatile market phases where high precision is critical
Ideal for traders who value refined entries, smart risk placement, and efficient exits
Why It Wins:
2EZ-UA-SS cuts through the noise. You’re not reacting late—you’re anticipating. Every entry is powered by multi-confirmation logic, and every exit is backed by smart volatility-aware levels.

Iambuoyant High Win Rate TraderIambuoyant High Win Rate Trader (Debug Signals) - Indicator Description
Introduction
The "Iambuoyant High Win Rate Trader" is a comprehensive Pine Script indicator designed to identify high-probability trading opportunities across various market conditions. Built with a multi-faceted approach, it integrates several key technical analysis concepts to provide robust buy and sell signals, aiming to maximize potential returns while managing risk. This indicator is particularly useful for traders looking for confirmed entries based on a confluence of factors rather than relying on a single signal.
Strategies Used
This indicator employs a sophisticated combination of strategies, each contributing to a stronger signal when aligned:
Trend Analysis:
Multiple EMAs: It utilizes three Exponential Moving Averages (EMAs) – a fast, slow, and a longer-term trend EMA – to establish the prevailing market direction. Signals are filtered to align with this identified trend, enhancing their probability of success.
Trend Alignment: Confirms that price action is consistent with the established EMA trend, ensuring trades are taken in the direction of momentum.
Oscillator Confirmation:
Relative Strength Index (RSI): Employs RSI to identify overbought and oversold conditions, with a specific focus on the RSI turning away from extreme levels, suggesting a potential reversal or continuation point.
Stochastic Oscillator: Similar to RSI, the Stochastic Oscillator is used to pinpoint overbought and oversold zones, with additional confirmation from the %K and %D lines crossing or turning.
Momentum and Divergence (MACD):
Moving Average Convergence Divergence (MACD): The indicator analyzes MACD line and signal line crossovers, alongside histogram movement, to gauge momentum shifts and potential trade entries.
Volume Analysis:
Volume Confirmation: Integrates volume analysis by comparing current volume to a Volume Moving Average. Higher-than-average volume during a signal can confirm conviction behind the price move.
Market Structure and Volatility:
Support and Resistance (S/R) Levels: Dynamic support and resistance levels are identified using pivot points. These levels are used to inform potential stop-loss placements and to ensure trades aren't initiated directly into strong opposing S/R zones.
Average True Range (ATR): ATR is used to measure market volatility, which helps in adjusting trade sizing and stop-loss distances. A volatility filter is included to prevent trades in excessively choppy or illiquid conditions.
Risk Management:
Dynamic Stop Loss: The indicator attempts to identify logical stop-loss levels based on recent price action or nearby support/resistance.
Risk:Reward Ratio Filtering: A configurable minimum Risk:Reward ratio ensures that only trades with a favorable potential return relative to the risk are considered, promoting disciplined trading.
Signal Confirmation:
Confirmation Bars: An optional confirmBars input allows for signals to be confirmed over a specified number of bars, reducing false positives by waiting for price action to sustain the initial signal. (Note: For debugging, this is often set to 0 for immediate signals.)
How to Use the Indicator
Add to Chart: Apply the "Iambuoyant High Win Rate Trader (Debug Signals)" indicator to your desired chart in TradingView. It's an overlay indicator, meaning it will plot directly on your price chart.
Understand the Signals:
Buy Signals (Green Triangles/Labels): Appear below the price bars, indicating a potential long entry.
Sell Signals (Red Triangles/Labels): Appear above the price bars, indicating a potential short entry.
"Flash" Signals: Smaller, colored triangles indicate the immediate bar where the signal conditions are first met.
"Confirmed" Signals: Larger, shaded triangles with labels indicate that the signal has passed the confirmBars criteria (if confirmBars is set to greater than 0).
Utilize Debugging Features (Crucial for Optimization):
Access Inputs: Open the indicator's settings by clicking the gear icon next to its name on the chart.
"Signal Components (Debugging)" Section: This is the most powerful feature for tailoring the indicator to your needs.
Initial Setup: When first applying the indicator or if signals are too rare, start by setting most "Enable X Condition" toggles to false, potentially leaving only one or two simple conditions (e.g., "Enable RSI Condition" or "Enable Trend Alignment") as true. This will force signals to appear, allowing you to confirm the plotting mechanism works.
Gradual Re-enabling: Once you see signals, gradually re-enable one "Enable X Condition" at a time.
Observe Debug Plots (Lower Pane): Below your main chart, the indicator plots colored columns (e.g., "Debug: RSI Bull", "Debug: MACD Bear"). These show when each individual component of the long/short signal is true (1 or 2) or false (0 or na). The "Debug: Final Long Signal" and "Debug: Final Short Signal" plots show when the combined signal conditions are met.
Identify Bottlenecks: If signals disappear after enabling a new condition, observe its corresponding debug plot. If it's frequently 0 when other conditions are 1, you've found a bottleneck.
Adjust Parameters: For bottlenecks, go back to the relevant input section (e.g., "Oscillators," "Market Structure," "Signal Quality") and adjust parameters (e.g., rsiOB/rsiOS, stochOB/stochOS, volatilityFilter, minRRRatio) to be less strict until signals appear at your desired frequency. Alternatively, you may decide to leave that specific condition disabled if it's too restrictive for your strategy.
Configure Display Options: Use the "Display" group in the inputs to toggle the visibility of labels, support/resistance lines, and EMA trend lines on your chart.
Set Up Alerts: The indicator includes built-in alert conditions for "Confirmed Buy Signal" and "Confirmed Sell Signal." You can set up alerts in TradingView to be notified instantly when these signals occur, allowing you to monitor the market without constant chart watching.

Rsi By Moshi MTF (1H Fixed)This script is a custom multi-timeframe RSI indicator called "Rsi By Moshi MTF (1H Fixed)". It combines RSI signals from the current timeframe (e.g. M15) with confirmation from the 1-hour RSI trend to generate buy/sell signals.
Main Features:
Calculates RSI, EMA, and WMA on the current chart timeframe.
Fetches real-time and previous RSI values from the 1-hour timeframe.
Generates buy signals when RSI crosses above its EMA and 1H RSI is rising.
Generates sell signals when RSI crosses below its EMA and 1H RSI is falling.
Offers optional horizontal RSI bands at key levels (20–80) for visual guidance.
Plots RSI, EMA, WMA, and triangle markers for buy/sell signals.
Includes built-in alert conditions for automation or notifications.

Custom Buy Signal Indicator//@version=5
indicator("Custom Buy Signal Indicator", overlay=true)
// INPUTS
emaLength = input.int(9, title="EMA Length")
supertrendLength = input.int(10, title="SuperTrend Length")
supertrendFactor = input.float(2.0, title="SuperTrend Factor")
keltnerLength = input.int(20, title="Keltner Channel Length")
keltnerMult = input.float(1.0, title="Keltner Multiplier")
avgVolLength = input.int(20, title="Average Volume Length")
// CALCULATIONS
price = close
ema9 = ta.ema(price, emaLength)
// Condition 1: Price Crosses Above 9 EMA
crossAboveEMA = ta.crossover(price, ema9)
// Condition 2: Price is above central pivot line (previous day)
pivotCentral = (high + low + close ) / 3
abovePivot = price > pivotCentral
// Condition 3: SuperTrend
= ta.supertrend(supertrendFactor, supertrendLength)
aboveSupertrend = price > supertrend
// Condition 4: VWAP
vwapLine = ta.vwap
aboveVWAP = price > vwapLine
// Condition 5: Above middle line of Keltner Channel
basisKC = ta.ema(price, keltnerLength)
rangeKC = ta.ema(high - low, keltnerLength)
upperKC = basisKC + keltnerMult * rangeKC
lowerKC = basisKC - keltnerMult * rangeKC
middleKC = basisKC
aboveKCmiddle = price > middleKC
// Condition 6: Above average volume
avgVol = ta.sma(volume, avgVolLength)
aboveAvgVol = volume > avgVol
// Combine all conditions
buySignal = crossAboveEMA and abovePivot and aboveSupertrend and aboveVWAP and aboveKCmiddle and aboveAvgVol
// Plotting
plotshape(buySignal, title="Buy Signal", location=location.belowbar, color=color.green, style=shape.labelup, text="BUY")
// Optional: Display Indicators
plot(ema9, title="EMA 9", color=color.orange)
plot(supertrend, title="SuperTrend", color=color.green)
plot(vwapLine, title="VWAP", color=color.blue)
plot(middleKC, title="KC Middle", color=color.purple)

Volatility Breakout Strategy W15_T2.0# How to Use This Indicator
## **Setup Instructions:**
**Adjust parameters** as needed:
- **Volatility Window**: 15 (default) for 15-period volatility calculation
- **Volatility Threshold**: 2.0 (default) for 2x volatility spike trigger
- **Price Direction Periods**: 5 (default) for trend direction detection
### **What You'll See:**
- **🟢 Green UP arrows**: BUY signals (high volatility + upward price movement)
- **🔴 Red DOWN arrows**: SELL signals (high volatility + downward price movement)
- **🟠 Orange circles**: EXIT signals (volatility cooled down)
- **🟨 Yellow background**: High volatility periods (above threshold)
- **📊 Info table**: Real-time volatility metrics (top-right corner)
### **Signal Logic:**
- **Entry**: When volatility ratio ≥ 2.0x AND price direction is clear
- **Exit**: When volatility ratio drops below 1.4x (70% of threshold)
- **Direction**: Based on 5-period price change
### **Best Timeframes:**
- **1-minute**: Very sensitive, many signals
- **5-minute**: Balanced (matches your original analysis)
- **15-minute**: Less frequent but higher quality signals
### **Alert Setup:**
The indicator includes built-in alerts for:
- Buy signals
- Sell signals
- Exit signals

Supertrend Scannernew one more script to scan stock based on buy or sell signal as per super trend strategy.

EMA Slope AngleTo help you find out how good is the current trend.If its positive look for longs and vise versa

[Top] Unified Divergence DetectorThe Unified Divergence Detector (UDD) is a powerful tool designed to identify both regular and hidden divergences across multiple oscillators—RSI, CCI, and Stochastic—in a single unified indicator.
Unlike other divergence tools that focus on one source at a time, this script cross-checks multiple indicators simultaneously and consolidates the results into a single signal. Labels appear only when at least one divergence is detected, with optional color-coding to distinguish the number and type of divergences:
🐂 Bullish Divergence: Signals a potential reversal or continuation to the upside.
🐻 Bearish Divergence: Signals a potential reversal or continuation to the downside.
The script lets users configure:
Whether to detect regular, hidden, or both types of divergence.
Pivot lookback parameters and divergence detection range.
Separate label colors for 1, 2, or 3+ confirmations from different indicators.
Tooltips are dynamically generated and offer guidance on interpreting each signal based on the oscillator sources involved and the divergence type. Labels are intelligently placed to avoid clutter and display only the strongest, most relevant signals.
⸻
Potential Uses
Trend Reversals: Spot early signs of exhaustion and prepare for a trend change.
Trend Continuations: Confirm existing trends via hidden divergence signals.
Multi-Timeframe Confirmation: Combine this indicator with higher timeframe trend tools to validate entries or exits.
Custom Strategy Building: Integrate into more complex strategies involving price action or volume filters.
⸻
This indicator is ideal for traders who value confirmation from multiple sources and prefer clear, high-confidence signals over constant alerts. It works well across all timeframes and asset classes.

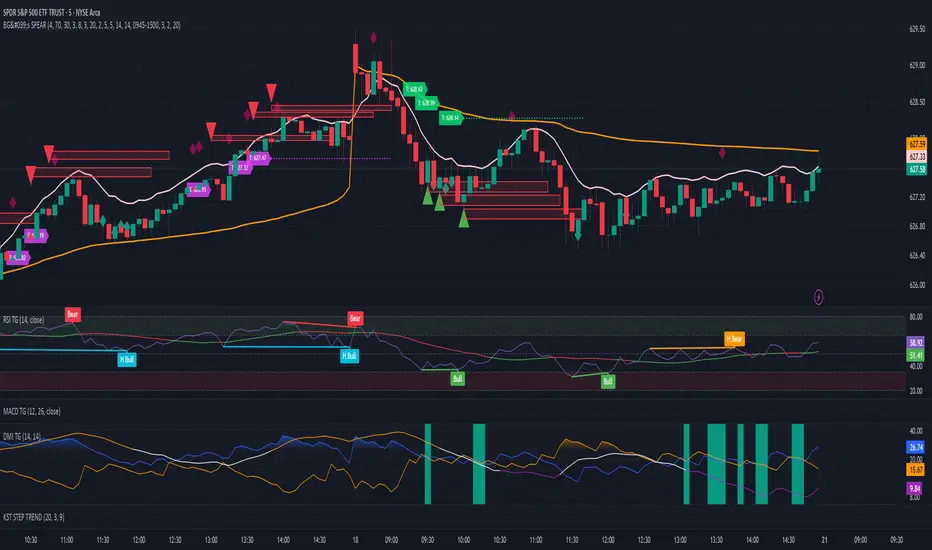
BG's SPEAR - SPY Precision Entry & Reversal (5min)BG's SPEAR - SPY Precision Entry & Reversal
Advanced Technical Analysis for SPY Intraday Trading
📊 Overview
BG's SPEAR is a comprehensive technical indicator designed for SPY intraday trading, combining multiple momentum oscillators and trend analysis to identify high-probability entry and exit points. The system integrates classic technical analysis with modern volatility filtering for enhanced signal quality.
🎯 Signal Types
Primary Signals:
Triangle markers indicate momentum-based entry opportunities
Enhanced signals provide additional confluence for higher-confidence trades
Color-coded system for easy visual identification
Supporting Analysis:
VWAP integration for institutional-level price analysis
Volatility-based filtering to focus on optimal market conditions
Session-specific optimization for intraday trading windows
📈 Key Features
✅ Multi-timeframe analysis with optimized parameters
✅ Risk management tools including target and stop visualization
✅ Customizable filtering for different market conditions
✅ Clean visual interface with minimal chart clutter
⚙️ Customization Options
Volatility threshold controls for signal frequency
Session time filtering for optimal trading windows
Target distance settings based on market volatility
Quality filters for signal refinement
Visual customization options
📋 Recommended Use
Best Performance:
SPY on 5-minute timeframes during regular market hours
Active trading sessions with adequate volatility
Experienced traders familiar with momentum-based strategies
Configuration:
Use default settings as starting point
Adjust volatility filters based on market conditions
Customize session times for your trading schedule
⚠️ Risk Disclosure
This indicator is for educational and analytical purposes only. All trading involves substantial risk of loss. Past performance does not guarantee future results. Users should conduct their own analysis and consult with qualified professionals before making trading decisions.
🔧 Technical Notes
Built using advanced Pine Script features including:
Multi-oscillator confluence analysis
Dynamic volatility adaptation
Professional-grade risk visualization
Optimized for SPY market microstructure
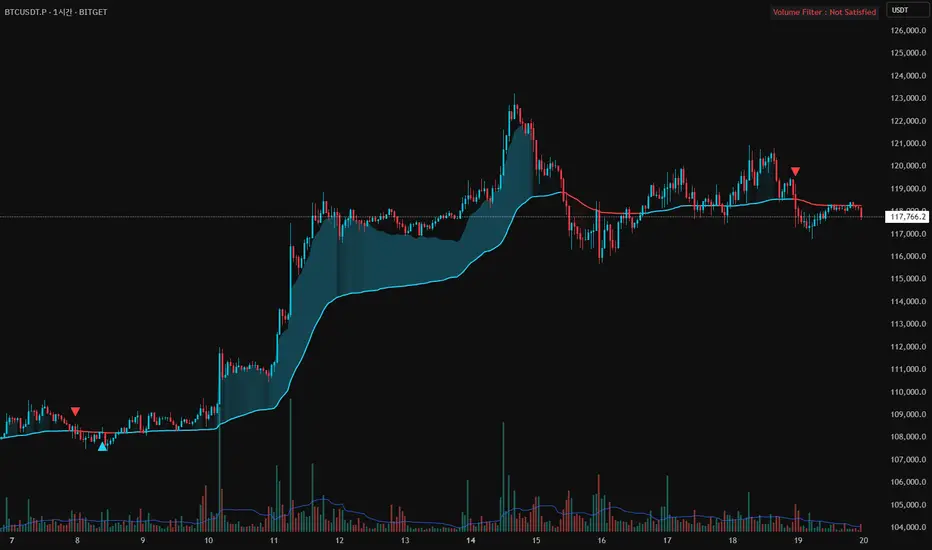
52SIGNAL RECIPE AMA Momentum Vector═══52SIGNAL RECIPE AMA Momentum Vector═══
◆ Overview
52SIGNAL RECIPE AMA Momentum Vector is an advanced technical indicator based on Adaptive Moving Average (AMA), integrating volume filtering and gradient zone visualization to provide comprehensive analysis of price trends and momentum.
It automatically adjusts to market conditions by calculating efficiency ratios, reducing noise while clearly capturing significant trends. The volume confirmation system helps traders identify high-probability entry and exit points with precision.
─────────────────────────────────────
◆ Key Features
• Adaptive Moving Average: Smart moving average that automatically adjusts based on market conditions
• Volume Filter Integration: Double-confirmation of important price movements through volume analysis
• Momentum Gradient Zones: Intuitive visualization of trend strength through color gradation
• Signal Confirmation System: Generation of high-reliability buy/sell signals by combining multiple factors
• Trend Direction Identification: Clear color distinction between bullish and bearish market conditions
• Automatic Adaptation: Intelligent design that self-adjusts to various market situations
─────────────────────────────────────
◆ Technical Foundation
■ AMA Calculation Principles
• Efficiency Ratio (ER): Measures how efficiently price moves in one direction
• Dynamic Smoothing Coefficient: Automatically adjusts faster or slower based on market conditions
• Adaptive Algorithm: Less sensitive during sideways markets, more responsive during trending markets
• Noise Reduction Function: Filters out meaningless price movements while capturing important signals
■ Momentum Vector Implementation
• Trend-Price Distance Calculation: Measures trend strength by the distance between AMA and current price
• Color Gradation: Visual system where color intensity changes proportionally to trend strength
• ATR-Based Adjustment: Automatically adjusts gradient zone width according to market volatility
• Directional Color Distinction: Intuitive display with blue/cyan for uptrends and red for downtrends
─────────────────────────────────────
◆ Practical Applications
■ Price Trend Interpretation
• Trend Direction Assessment:
▶ Price above AMA with blue gradation indicates ongoing bullish momentum
▶ Price below AMA with red gradation indicates ongoing bearish momentum
• Momentum Strength Verification:
▶ Deeper gradient colors mean stronger momentum and healthier trends
▶ Lighter gradient colors suggest weakening momentum and potential reversal
■ Trading Strategy Utilization
• Trend Following Strategy:
▶ Buy signal when price crosses above AMA with increased volume
▶ Sell signal when price crosses below AMA with increased volume
• Momentum Confirmation Trading:
▶ Deep gradation increases confidence in trend continuation for entry decisions
▶ Multiple consecutive candles staying on one side of AMA increases trend reliability
─────────────────────────────────────
◆ Advanced Configuration Options
■ Input Parameter Guide
• Fast Period (Default: 2)
▶ 1-2: Responds very quickly to price changes. Suitable for short-term trading.
▶ 3-5: Moderate response that reduces frequent signals.
▶ 6-10: Slower response but captures only more definitive trends.
• Slow Period (Default: 30)
▶ 20-25: AMA moves faster. Good for shorter timeframe trading.
▶ 26-35: Balanced speed suitable for most market conditions.
▶ 36-50: AMA moves slowly, smoothly following long-term trends.
• Efficiency Ratio Period (Default: 10)
▶ 5-8: Focuses more on recent price movements. Responds quickly to changes.
▶ 9-12: Balanced period suitable for most situations.
▶ 13-20: Considers longer-term price movements, ignoring temporary fluctuations.
• Volume Average Period (Default: 20)
▶ 10-15: Compares with the average volume of the last 10-15 days. More sensitive to changes.
▶ 16-25: Compares with the average volume of approximately the last month. Balanced setting.
▶ 26-50: Compares with long-term average volume, capturing only truly significant volume changes.
• Volume Threshold Multiplier (Default: 1.2)
▶ 1.0-1.1: Recognizes volume just 10% above average as valid.
▶ 1.2-1.5: Requires volume 20-50% higher than average (e.g., 1.2 means 120% of average).
▶ 1.6-2.0: Recognizes only very high volume at least 1.6 times (160%) above average.
■ Timeframe-Specific Recommended Settings
• Short Timeframes (5min-1hr):
Fast Period 2, Slow Period 20, Efficiency Ratio Period 8
→ Responds quickly to price changes, suitable for day trading.
• Medium Timeframes (4hr-daily):
Fast Period 2, Slow Period 30, Efficiency Ratio Period 10
→ Most balanced setting for general swing trading.
• Long Timeframes (daily-weekly):
Fast Period 2, Slow Period 40, Efficiency Ratio Period 14
→ Optimized for smoothly tracking longer trends.
■ Market-Specific Recommended Settings
• Stock Market:
Volume Threshold 1.2, Volume Average Period 20
→ Signal is valid when volume is 20% above average.
• Forex Market:
Volume Threshold 1.5, Efficiency Ratio Period 12
→ Forex requires higher volume to be meaningful and slightly longer efficiency measurement.
• Cryptocurrency Market:
Volume Threshold 1.3, Fast Period 2, Slow Period 25
→ Settings optimized for highly volatile cryptocurrencies.
─────────────────────────────────────
◆ Synergy with Other Indicators
• Moving Averages: Trend reliability increases when AMA and key moving averages point in the same direction
• RSI/Stochastic: Powerful reversal signals when AMA crossovers occur in overbought/oversold zones
• MACD: Signal probability greatly increases when MACD histogram direction changes coincide with AMA crossovers
• Bollinger Bands: Trend strength can be determined by AMA's position within Bollinger Bands
• Support/Resistance Levels: Success probability dramatically increases when AMA breakouts occur at key price levels
─────────────────────────────────────
◆ Conclusion
AMA Momentum Vector provides accurate price trend analysis by combining the advanced features of adaptive moving averages with momentum visualization technology.
It perfectly adapts to constantly changing market environments through its self-adjusting algorithm and generates highly reliable trading signals through its volume confirmation system.
Users can optimize the indicator for their trading style and market conditions with simple parameter adjustments, enabling effective trading decisions that comprehensively consider price direction, momentum strength, and volume confirmation.
─────────────────────────────────────
※ Disclaimer: Past performance does not guarantee future results. Always use appropriate risk management strategies.
═══52SIGNAL RECIPE AMA Momentum Vector═══
◆ 개요
52SIGNAL RECIPE AMA Momentum Vector는 적응형 이동평균(AMA)을 기반으로 한 고급 기술적 지표로, 볼륨 필터링과 그라데이션 존 시각화를 통합하여 가격 추세와 모멘텀을 종합적으로 분석합니다.
시장 효율성 비율을 자동으로 계산하여 시장 상황에 맞게 스스로 조정되며, 노이즈는 줄이고 중요한 추세는 선명하게 포착합니다. 또한 볼륨 확인 시스템을 통해 높은 확률의 매매 시점을 정확하게 식별할 수 있도록 도와줍니다.
─────────────────────────────────────
◆ 주요 특징
• 적응형 이동평균: 시장 상황에 따라 자동으로 조정되는 스마트한 이동평균선
• 볼륨 필터 통합: 중요한 가격 움직임을 볼륨으로 한번 더 확인
• 모멘텀 그라데이션 존: 색상 그라데이션으로 추세의 강도를 직관적으로 시각화
• 신호 확인 시스템: 여러 요소를 종합하여 신뢰도 높은 매수/매도 신호 생성
• 추세 방향 식별: 상승세와 하락세를 색상으로 명확하게 구분
• 자동 적응 기능: 다양한 시장 상황에 알아서 맞춰지는 지능형 설계
─────────────────────────────────────
◆ 기술적 기반
■ AMA 계산 원리
• 효율성 비율 (ER): 가격이 얼마나 효율적으로 한 방향으로 움직이는지 측정
• 동적 평활화 계수: 시장 상황에 따라 빠르거나 느리게 자동 조절되는 계수
• 적응형 알고리즘: 횡보장에서는 둔감하게, 추세장에서는 민감하게 반응
• 노이즈 감소 기능: 무의미한 가격 움직임은 걸러내고 중요한 신호만 포착
■ 모멘텀 벡터 구현
• 추세-가격 거리 계산: AMA와 현재 가격 사이의 거리로 추세 강도 측정
• 색상 그라데이션: 추세 강도에 비례하여 색상 농도가 변하는 시각화 시스템
• ATR 기반 조정: 시장 변동성에 맞춰 그라데이션 영역 너비 자동 조절
• 방향성 색상 구분: 상승세는 파란색/청록색, 하락세는 빨간색으로 직관적 표시
─────────────────────────────────────
◆ 실용적 응용
■ 가격 추세 해석
• 추세 방향 판단:
▶ 가격이 AMA 위에 있고 파란색 그라데이션이 보이면 상승 모멘텀 진행 중
▶ 가격이 AMA 아래에 있고 빨간색 그라데이션이 보이면 하락 모멘텀 진행 중
• 모멘텀 강도 확인:
▶ 그라데이션 색상이 진할수록 모멘텀이 강하고 추세가 건강함을 의미
▶ 그라데이션 색상이 옅을수록 모멘텀이 약해지고 있으며 반전 가능성 시사
■ 트레이딩 전략 활용
• 추세 추종 전략:
▶ 가격이 AMA를 상향 돌파하고 볼륨이 증가하면 매수 신호
▶ 가격이 AMA를 하향 돌파하고 볼륨이 증가하면 매도 신호
• 모멘텀 확인 트레이딩:
▶ 진한 그라데이션은 추세 지속 가능성이 높음을 의미하므로 진입 확신 강화
▶ 여러 캔들이 연속해서 AMA 한쪽에 머물면 추세의 신뢰도가 높아짐
─────────────────────────────────────
◆ 고급 설정 옵션
■ 인풋 파라미터 가이드
• 빠른 기간 (Fast Period) (기본값: 2)
▶ 1-2: 가격 변화에 매우 빠르게 반응합니다. 단기 거래에 적합합니다.
▶ 3-5: 적당히 반응하여 잦은 신호를 줄여줍니다.
▶ 6-10: 반응이 느리지만 더 확실한 추세만 포착합니다.
• 느린 기간 (Slow Period) (기본값: 30)
▶ 20-25: AMA가 더 빠르게 움직입니다. 짧은 시간 거래에 좋습니다.
▶ 26-35: 균형 잡힌 속도로 대부분의 시장 상황에 적합합니다.
▶ 36-50: AMA가 천천히 움직여 장기 추세를 부드럽게 따라갑니다.
• 효율성 비율 기간 (Efficiency Ratio Period) (기본값: 10)
▶ 5-8: 최근 가격 움직임에 더 집중합니다. 변화에 빠르게 반응합니다.
▶ 9-12: 균형 잡힌 기간으로 대부분의 상황에 적합합니다.
▶ 13-20: 더 긴 기간의 가격 움직임을 고려하여 일시적인 변동을 무시합니다.
• 볼륨 평균 기간 (Volume Average Period) (기본값: 20)
▶ 10-15: 최근 10-15일의 평균 볼륨과 비교합니다. 변화에 민감합니다.
▶ 16-25: 지난 약 한 달간의 평균 볼륨과 비교합니다. 균형 잡힌 설정입니다.
▶ 26-50: 장기 평균 볼륨과 비교하여 정말 큰 볼륨 변화만 포착합니다.
• 볼륨 임계값 승수 (Volume Threshold Multiplier) (기본값: 1.2)
▶ 1.0-1.1: 평균보다 약 10% 정도만 높아도 유효한 볼륨으로 인정합니다.
▶ 1.2-1.5: 평균보다 20~50% 높은 볼륨을 요구합니다(예: 1.2는 평균의 120%).
▶ 1.6-2.0: 평균의 최소 1.6배(160%) 이상 되는 매우 높은 볼륨만 인정합니다.
■ 타임프레임별 추천 설정
• 짧은 시간 차트 (5분-1시간):
빠른 기간 2, 느린 기간 20, 효율성 비율 기간 8
→ 가격 변화에 빠르게 반응하며 단타에 적합합니다.
• 중기 차트 (4시간-일봉):
빠른 기간 2, 느린 기간 30, 효율성 비율 기간 10
→ 일반적인 스윙 트레이딩에 가장 균형 잡힌 설정입니다.
• 장기 차트 (일봉-주봉):
빠른 기간 2, 느린 기간 40, 효율성 비율 기간 14
→ 더 긴 추세를 매끄럽게 추적하는 데 최적화되었습니다.
■ 시장별 추천 설정
• 주식 시장:
볼륨 임계값 1.2, 볼륨 평균 기간 20
→ 평균보다 20% 많은 볼륨이 있을 때 신호가 유효합니다.
• 외환 시장:
볼륨 임계값 1.5, 효율성 비율 기간 12
→ 외환은 볼륨이 더 높아야 의미가 있으며, 약간 더 긴 효율성 측정이 필요합니다.
• 암호화폐 시장:
볼륨 임계값 1.3, 빠른 기간 2, 느린 기간 25
→ 변동성이 큰 암호화폐에 최적화된 설정입니다.
─────────────────────────────────────
◆ 다른 지표와의 시너지
• 이동평균선: AMA와 주요 이동평균선이 같은 방향을 가리킬 때 추세 신뢰도 상승
• RSI/스토캐스틱: 과매수/과매도 구간에서 AMA 교차 발생 시 강력한 반전 신호
• MACD: MACD 히스토그램 방향 변화와 AMA 교차가 일치하면 신호 확률 대폭 증가
• 볼린저 밴드: AMA가 볼린저 밴드 내에서 어떤 위치에 있는지로 추세 강도 판단
• 지지/저항 레벨: 중요 가격대에서 AMA 돌파 시 성공 확률이 크게 증가
─────────────────────────────────────
◆ 결론
AMA Momentum Vector는 적응형 이동평균의 고급 기능과 모멘텀 시각화 기술을 결합하여 정확한 가격 추세 분석을 제공합니다.
자체 조정 알고리즘으로 시시각각 변하는 시장 환경에 완벽하게 적응하며, 볼륨 확인 시스템을 통해 신뢰도 높은 매매 신호를 생성합니다.
사용자는 간단한 파라미터 조정으로 자신의 거래 스타일과 시장 상황에 맞게 지표를 최적화할 수 있어, 가격 방향, 모멘텀 강도, 볼륨 확인을 종합적으로 고려한 효과적인 거래 결정을 내릴 수 있습니다.
─────────────────────────────────────
※ 면책 조항: 과거 성과가 미래 결과를 보장하지 않습니다. 항상 적절한 리스크 관리 전략을 사용하세요.
Bollinger BandsThe simple R/S indicator with the Bollinger Bands.
It has the ability to notify a "BB","QQE" signal with a crossover.

Frothy Oscillator📘 Description:
The Frothy Oscillator is a custom momentum tool designed to help identify periods of market acceleration, cooling, and potential macro turning points. It has been developed specifically for use on the Bitcoin chart but it's also seemingly ok to be used across any chart with enough data. By smoothing key signals into a single view, it aims to offer a cleaner perspective on long-term market momentum.
⸻
⚠️ Disclaimer:
This script is for educational and informational purposes only. It is not financial advice. Always do your own research and consult a professional before making trading decisions.

AI Market Trend Analysis [Cryptovarthagam]📌 Market Trend AI
🔥 Advanced Trend Detection + Smart Entry Engine by Cryptovarthagam™
🧠 What is This?
Market Trend AI is a high-performance trading assistant built by Cryptovarthagam™, designed to help scalpers and intraday traders decode market behavior. This AI-inspired system combines trend detection, momentum-volume validation, and candle reversal analysis to identify clean and confident trade setups.
⚙️ Core Features
✅ AI-Based Market Trend Detection
ADX Strength + EMA Slope = Confirmed Trend Direction
Bollinger Band Width Filter = Avoid Choppy Sideways Zones
Detects:
🟩 Uptrends
🟥 Downtrends
⬜ Sideways Markets (Auto-filtered)
🔍 Momentum + Volume Signal Engine
Detects momentum shifts via RSI
Captures volume spikes vs. 20-period average
Classifies entries into:
✅ Strong Volume & Momentum
🟠 Volume Without Momentum
💜 Momentum Without Volume
🔁 Candle Reversal Confirmation
Detects rejection candles with large wicks
Validates uptrend-to-downtrend and downtrend-to-uptrend shifts
Highlights possible early trend reversals
💥 Big Candle Detection
Spots big institutional candles (based on average body size + volume)
Filters fake moves by validating strong price action
🧠 Dynamic Visuals
Background Zones auto-color the chart for trend clarity
Live Label shows:
Trend direction
ADX strength
ASCII-style strength bar (fun and functional)
🧭 How to Use (Scalper Playbook)
✅ Wait for valid UP/DOWN trend confirmation (avoid SIDEWAYS).
🔍 Watch for momentum + volume confluence.
🔁 Confirm with a wick rejection candle near major levels.
💣 Enter on Big Candle Breakouts or Rejection Confirmations.
📢 Use built-in alerts to automate your reaction.
Best Timeframes: 5m, 15m, or 1H on Binance Futures, Forex, or Crypto Spot.
⚠️ Disclaimer (House Rules Compliance)
This script is for educational purposes only.
No financial advice is given or implied.
Always backtest and paper trade before live use.
Cryptovarthagam™ is not liable for any trading losses.
🧰 Recommended Add-ons
Use alongside TradingView's default Bollinger Bands.
Apply Pivot Zones or Auto S/R indicators for stronger setups.
Combine with your favorite volume or OBV-based tools.
💎 Script designed by Cryptovarthagam™ — Building Precision Tools for Smart Traders.
If you fork, please credit the original author.

ETH Gas Pulse Oscillator v2.2The ETH Gas Pulse Oscillator by OrbitPips is a smart congestion tracking tool designed to help crypto traders assess Ethereum network activity and anticipate gas fee spikes in real-time.
💡 Core Features:
- Tracks ETH gas usage using price volatility, volume pressure, and ETH/BTC momentum
- Adaptive thresholding based on timeframe volatility
- Color-coded pulse histogram with extreme zone highlights
- Real-time estimated gas price (Gwei) and network status display
- 1H and 4H only (auto-warning for unsupported timeframes)
📊 Table Display Includes:
- ETH price
- Gas pulse score
- Volume ratio
- Estimated gas fee (Gwei)
- ETH/BTC momentum
- Status classification: 🔥 Extreme High, 📉 Low, ⚖️ Neutral, etc.
🔔 Alerts fire on gas congestion spikes and drops. Perfect for L2 bridge traders, dApp deployers, and scalpers watching for gas windows.
🌐 Built by (orbitpips.com)
⚠️ *This script only supports 1H and 4H timeframes to ensure accuracy.*

Signalgo BBSignalgo BB: Technical Overview
Signalgo BB is an advanced Bollinger Bands (BB) indicator for TradingView, designed to provide a multi-dimensional view of volatility, trend, and trading opportunities within a single overlay. Below is a detailed, impartial explanation of its workings, inputs, and trading logic.
Core Mechanics
Signalgo BB operates on the principle of nested volatility bands and moving averages. It calculates:
Fast & Slow Bands: Two sets of Bollinger Bands (BB), using different moving average types (EMA or SMA), lengths, and standard deviation multipliers.
Volatility Cloud: A dynamic visual layer indicating when price is inside both, one, or neither band.
Filtering: A short-term RSI is used to confirm trend direction and filter out weak signals.
Inputs & Components
MA Type: Choice between EMA, SMA for both fast and slow MA calculations.
Fast/Slow Lengths
Fast/Slow Deviations
RSI Length/Thresholds
Show Cloud: Toggle for the visual volatility cloud.
Signal Mode: Band Break.
Prevent Repeated Signals: Option to suppress duplicate signals in the same direction.
TP/SL & Trailing Logic: Advanced, automated trade management with ATR-based distances, three take-profit levels, and a dynamic trailing stop.
Signal Generation
Band Break: Triggers when price crosses the fast BB band.
RSI Filter: All signals require RSI confirmation.
Prevent Repeated Signals: Optionally only marks the first breakout in a series to reduce overtrading.
Entry/Exit Marks: Labels are plotted for visual clarity, and signals can trigger TradingView alerts.
Trade Management
Stop Loss (SL): Set at a multiple of ATR from the entry price, adapting to current volatility.
Take Profits (TP1, TP2, TP3): Three levels scaled by risk-reward ratios, supporting partial exits.
Trailing Stop: After the first TP is hit, SL moves to breakeven and then trails at a user-defined multiple of ATR, locking in further gains.
Event Markers: Each TP, SL, and trailing stop event is labeled on the chart.
Direction State: The indicator tracks active trades, allowing for only one open position per direction at a time.
Cloud Visualization: The background color changes depending on whether price is inside both, one, or no bands, making it easier to visualize market conditions.
Multiple Signal Logics: It doesn’t just look at breakouts—it includes cloud crossings, mean reversion, and a choice of how to combine them.
Rigorous Filtering: Signals require RSI trend confirmation, reducing false entries during weak phases.
Automated Trade Management: Built-in TP/SL and trailing logic, dynamically adapting to volatility.
Signal Suppression: Option to prevent repeated signals, reducing noise and overtrading.
Customizable MA Types: Supports EMA, SMA, and a selection algorithm for future expansion.
Trading Strategy Application
Volatility Regimes: The cloud’s color indicates whether price is inside, between, or outside the bands, helping traders identify trending, ranging, or breakout conditions.
Signals: entries can be based on breakouts filtered by RSI trend strength.
Risk Management: All active trades are managed by TP/SL logic, trailing stops after TP1, and visual feedback on exits.
Visual Alerts: Both signals and TP/SL events are marked on the chart for manual review.
Flexibility: Users can switch modes or suppress repeated signals as needed, depending on trading style.
Why This Approach is Unique
While the concepts of Bollinger Bands, moving averages, and RSI filtering are widely used, Signalgo BB combines and layers them in a proprietary fashion that is not standardized in public indicators. The integration of multiple, nested bands, dynamic cloud visualization, strict RSI filtering, and adaptive trade management is not reproducible without access to the underlying, protected logic.
Practical Usage
Intraday to Swing: Suitable for timeframes from minutes to days, depending on the MA periods and volatility profile.
Manual or Automated: The visual overlay and alerts support both manual trading and automated strategies.
Education & Review: The colored cloud and event markers make it easy to review past price action and learn from signals.

Jitendra MTF AIO Technical + Trend Analysis ▲▼Summary of “Jitendra MTF AIO Technical + Trend Analysis ▲▼
🔍 Purpose
This script is a multi-timeframe (MTF) technical analysis dashboard that displays multiple indicators, trends, divergences, and volume signals in a dynamically structured table format on the chart. It also overlays key EMAs and optionally Bollinger Bands.
How It's useful or How Can You Change Setting
drive.google.com
How to Analysis Data For Bullish & Bearish Trade
GREEN Background Shows Positive Crossover and RED Background Shows Negative Crossover
If LTP Above VWAP, it will show value with GREEN Background else RED Background
If MACD Line Above Signal line it will show GREEN Background or MACD Line Below Signal line it will show RED Background
Data Positive/negative value Value help us to find its above Zero or Below Zero Line
▲ = MACD rising, ▼ = MACD falling show current value is improving or losing as compare to prev value
RSI Data Value with Background Color to Find in Which Time Frame it is in High Strength
RSI Above 60 Show value with AQUA Color 🟦
RSI Between 40-60 Show value with GREEN Color 🟩
RSI Below 40 Show value with RED Color 🟥
ADX ,+DI, -DI Color
> 25 🟦 color.aqua Strong trend (bullish or bearish)
18–25 🟩 color.green Moderate trend (developing trend)
< 18 🟥 color.red Weak or no trend (sideways/consolidation)
Types of Divergence Detected
✅ Bullish Divergence Price makes lower low, RSI makes higher low "✔ Bullish"
❌ Bearish Divergence Price makes higher high, RSI makes lower high "✔ Bearish"
✅ Hidden Bullish Divergence Price makes higher low, RSI makes lower low "✔Bullish RD"
❌ Hidden Bearish Divergence Price makes lower high, RSI makes higher high "✔Bearish RD"
⚪ None No divergence detected "-"
Table EMA Color Coding
Price > EMA 🟩 Green Bullish (price above EMA)
Price < EMA 🟥 Red Bearish (price below EMA)
Volume Matrix Description
Volume Actual volume for the candle
20 SMA Volume 20-period simple moving average of volume (avg vol)
Volume % Rise % difference of current volume vs 20 SMA volume
Volume > SMA Volume 🟢 Green Bullish / high interest
Volume < SMA Volume 🔴 Red Low interest
Bollinger Band
If Band is Challenged Upside with RSI value Above 60+ And ADX above 20 it is in High Bullish Momentum , if 1 Higher Timeframe also supporting such value
If Band is Challenged Downside with RSI value Below 40 And ADX above 20 it is in High Bearish Momentum , if 1 Higher Timeframe also supporting such value
Stochastic Oscillator
Stochastic Oscillator is a momentum indicator comparing the current closing price to a range of its prices over a specific period. It indicates overbought and oversold conditions.
For Perfect Entry in Bullish Trade
If Higher TF Stochastic in oversold zone and doing Positive crossover, and also lower TF Stochastic will do positive crossover it will give High Probability Uptrend Entry
For Perfect Entry in Bearish Trade
If Higher TF Stochastic in Bought zone and doing Negative crossover, and also lower TF Stochastic will do Negative crossover it will give High Probability Uptrend Entry
%K (Fast): Measures current close vs the high-low range over the last 14 bars.
%D (Slow): 3-period SMA of %K.
%K above %D will show GREEN background
%K below %D will show RED background
Low Value, below 20 with GREEN background means it just done Positive Cross over from oversold zone
High Value with RED background means it just done negative Cross over from oversold zone
======== COMMUNICATIVE SHORT DESCRIPTION OF ALL INDICATOR=========
TF Timeframe label (e.g., CurTF, 1h, 4h, D, W, M)
VWAP Value of VWAP; green = price above, red = price below
MACD MACD Line Value
Trend ▲ = MACD rising, ▼ = MACD falling
MACD Hist MACD Histogram value (if enabled)
RSI RSI Value with background color showing strength
RSI▲▼ ▲ = RSI rising, ▼ = RSI falling
ADX ADX strength (trend strength, colored)
ADX▲▼ ▲ = ADX rising, ▼ = falling
+DI Positive Directional Indicator
+DI▲▼ ▲/▼ for DI+ trend
-DI Negative Directional Indicator
-DI▲▼ ▲/▼ for DI- trend
Div RSI divergence type: Bullish, Bearish, Hidden, or None (✔ or -)
EMA5 EMA5 value; green = price above, red = price below
EMA21 EMA21 value (same color logic as above)
EMA50 EMA50 value (same logic)
Cross ▲ = EMA5 > EMA21, ▼ = EMA5 < EMA21
Stoch %K %K value; green = K > D, red = K < D
Vol Volume for that TF; green = above avg, red = below avg
AvgVOL20 20 SMA of volume
%Vol Chng % Change in volume from its 20 SMA; green = rising, red = falling
========================================================
📊 Core Features & Code used to Fetch Calculate Data
Using request.security() to fetch data from different timeframes
✅ Indicator Plotting on Chart
EMA 1 & EMA 2: Plotted as overlays with customizable lengths and toggle.
Bollinger Bands: Optional plotting of upper, lower, and basis lines.
🧮 Multi-Timeframe Support
Supports analysis for:
Current Timeframe (optional)
1H, 4H, Daily, Weekly, and Monthly (customizable & optional)
📈 Indicators Displayed per Timeframe
Each selected timeframe row shows the following (based on toggles):
➤ VWAP Status
Price above or below VWAP with color indication
vwapVal = ta.vwap(hlc3)
vwapColor = close > vwapVal ? color.green : color.red
➤ MACD
MACD value
Optional MACD Trend Arrow (▲/▼)
Optional MACD Histogram
= ta.macd(close, 12, 26, 9)
macdColor = macdLine > signalLine ? color.green : color.red
➤ RSI
RSI value with dynamic background color (green, aqua, red)
Optional RSI arrow (based on RSI momentum direction)
rsi = ta.rsi(close, 14)
rsiColor = rsi > 70 ? color.red : rsi < 30 ? color.green : color.gray
rsiArrow = rsi > rsi ? "▲" : rsi < rsi ? "▼" : "-"
rsiArrowColor = rsi > rsi ? color.green : rsi < rsi ? color.red : color.gray
➤ ADX
ADX value with strength-based coloring
Optional ADX trend arrow
➤ +DI / -DI
Directional movement values with optional trend arrows
ad = ta.adx(14)
adxColor = ad > 25 ? color.aqua : ad >= 18 ? color.green : color.red
➤ RSI Divergence
Detects and displays:
Regular Bullish / Bearish Divergence
Hidden Bullish / Bearish Divergence
isBullishDiv = (low < low ) and (rsi > rsi )
isHiddenBullDiv = (low > low ) and (rsi < rsi )
➤ EMA Status
Displays EMA 1/2/3 value
Shows whether price is above (green) or below (red)
Optionally displays EMA1 vs EMA2 crossover as ▲ / ▼
ema = ta.ema(close, length)
emaColor = close > ema ? color.green : color.red
crossSymbol = ema5 > ema21 ? "▲" : ema5 < ema21 ? "▼" : "-"
➤ Stochastic
%K line with color-coded trend vs %D
k = ta.stoch(close, high, low, 14)
d = ta.sma(k, 3)
stochColor = k > 80 ? color.red : k < 20 ? color.green : color.gray
➤ Volume Matrix
Volume
20 SMA Volume
% Change in Volume from 20 SMA
Backgrounds indicate rising/falling volume trend
smaVolume = ta.sma(volume, 20)
volRise = ((volume - smaVolume) / smaVolume) * 100
🧠 Modular Settings
All features have individual on/off toggles in the input panel.
User can also customize:
EMA lengths
Stochastic smoothing parameters
Divergence lookback settings
Table position and text size
📐 Dynamic Table
Header row and rows per timeframe
Column count automatically adjusts based on enabled indicators
~~~~~~~~~~~~~~~~~~~~~~
-------------------------------
Thanks Jitendra
-------------------------------
~~~~~~~~~~~~~~~~~~~~~~

Hamstrade MomemtumHamstrade Momentum
is a custom momentum indicator built upon principles of traditional oscillators, optimized to identify short-term shifts and potential reversal zones.
Features:
- Smoothed momentum calculation with dynamic filtering
- Visual BUY/SELL labels directly on the chart
- Background shading for overbought/oversold areas
- Built-in alert conditions for automation
This invite-only script is designed for users within the Hamstrade community. Contact the author for access.
Disclaimer: This tool is for educational and analytical purposes only. Use at your own risk with proper risk management.

Gaussian Channel [DW] with RSI Ichimoku Weighted CenterlineGaussian Channel for RSI. in progress. move your screen to anchor it to a different time/x-axis value

Net Change Anchored• Sets reference price to the opening price of your chosen anchor period.
• Generates Normalized Change by dividing the scaled net move by the weighted average absolute one-bar move across current + N past spans.
• Computes Net Change %: (close – period-open) ÷ period-open × 100, and Log Return %: log(close ÷ period-open) × 100.
• Toggle Net Change %, Log Return % and Normalized Change on or off.

2EZ-UA-QS🔹 2EZ-UA-QS – Quick Scalps
Built for speed. Trusted for accuracy.
2EZ-UA-QS is your momentum-tracking tool for rapid scalping in ultra-low timeframes. Designed for traders who thrive in motion, this indicator catches the first breath of a trend and hands you the entry—clean, clear, and fast.
Core Features:
⚡ Fast Momentum Detection: Tracks momentum shifts using lightweight logic
⚡ Simplified Signal Engine: Optimized for 1s, 15s, and 1m scalping without lag
⚡ Fixed TP & SL System: Plots high-probability micro targets for exit discipline
⚡ Low Overhead: Runs smooth on fast timeframes—ideal for quick execution setups
⚡ Built-In Risk Control: Minimal drawdown logic for small position, high-frequency plays
⚡ No Noise Logic: Filters out signals in consolidation zones
When to Use:
Micro-scalping in high-volume sessions
Assets with tight spreads (FX majors, BTC, ES, NASDAQ)
When speed, not complexity, is your trading edge
Why It Wins:
2EZ-UA-QS is about responsiveness. It doesn't drown you in data—it gives you what you need right now. Ideal for prop traders, scalping bots, and execution-focused strategies where milliseconds count.
