Industry Group Strength (Custom ETFs)This script is a modified version of the 'Industry Group Strength' indicator. It enhances the 'Investment Trusts/Mutual Funds' category by incorporating a curated list of key Sector and Thematic ETFs (e.g., SMH, XBI, BLOK) for top-down market analysis. This allows traders to track broad sector rotation while retaining the original functionality of ranking individual stocks within their specific industries based on Relative Strength.
Indicators and strategies

Diganta ATR LevelsThis Script Plots the ATR levels based on the following logic
1. The Open price of 9.15 is considered.
2. Then based on the Open Price the ATR levels are plotted.
3. The ATR length is 180
4. ATR multiplier is 1 ( extended by 25% on both sides)

Diganta Straddle PlotThis Script Plots the ATM Straddle .
The Straddle strike can be selected
The Straddle expiry can be selected
This works on all Time Frame.
A blue signal line gets plotted from 9.15 Close of straddle price as a reference line

🚀 Enhanced BUY & SELL Pullback Scanner🚀 Enhanced BUY & SELL Pullback Scanner🚀 Enhanced BUY & SELL Pullback Scanner🚀 Enhanced BUY & SELL Pullback Scanner🚀 Enhanced BUY & SELL Pullback Scanner🚀 Enhanced BUY & SELL Pullback Scanner🚀 Enhanced BUY & SELL Pullback Scanner🚀 Enhanced BUY & SELL Pullback Scanner🚀 Enhanced BUY & SELL Pullback Scanner🚀 Enhanced BUY & SELL Pullback Scanner🚀 Enhanced BUY & SELL Pullback Scanner🚀 Enhanced BUY & SELL Pullback Scanner🚀 Enhanced BUY & SELL Pullback Scanner

🚀 Enhanced BUY & SELL Pullback ScannerThis script help to find the scan the script. this sis dor testing

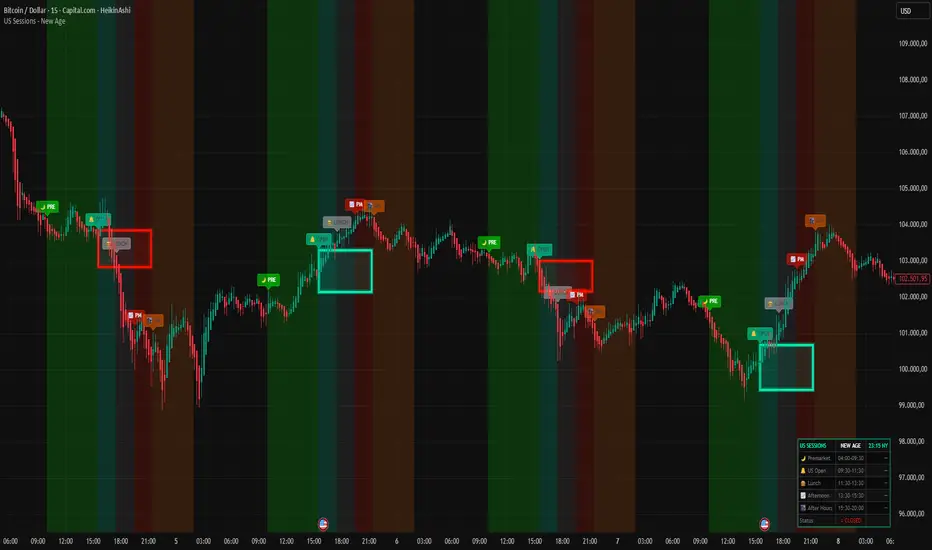
US Sessions - New Age 🚀 US SESSIONS - NEW AGE
Finally. A session indicator that doesn't look like it was made in 2005.
Welcome to the New Age. 🔮
━━━━━━━━━━━━━━━━━━━━━━━━━━━━━━━━━━━━━━━━━━━━━━
🎯 WHAT IT DOES
Visualizes US market sessions with NEON style backgrounds:
🌙 Premarket (04:00-09:30 NY) — Bright Green
🔔 US Open (09:30-11:30 NY) — Cyan
🍔 Lunch Break (11:30-13:30 NY) — Silver
📈 Afternoon (13:30-15:30 NY) — Red
🌃 After Hours (15:30-20:00 NY) — Orange
All times are automatically synced to New York timezone (EST/EDT).
No more manual calculations. No more confusion. Just works.™
━━━━━━━━━━━━━━━━━━━━━━━━━━━━━━━━━━━━━━━━━━━━━━
⭐ BONUS: ORB BOX (Opening Range Breakout)
This is the secret weapon. 🔥
The indicator automatically draws a NEON GLOWING box around the first 15 minutes of trading (9:30-9:45 NY). This is the Opening Range — one of the most powerful concepts in day trading.
📦 HOW THE ORB BOX WORKS:
- Box shows the HIGH and LOW of the first 15-minute candle
- Box extends from 9:45 until 15:30 (end of regular session)
- 🔵 CYAN GLOW = Price is ABOVE the ORB → Bullish bias
- 🔴 RED GLOW = Price is BELOW the ORB → Bearish bias
The color changes LIVE as price moves. Instant visual feedback!
Why does this matter?
→ 70%+ of the time, price will break and HOLD one side of the ORB
→ The direction of the first breakout often defines the trend for the day
→ Use it as dynamic support/resistance
━━━━━━━━━━━━━━━━━━━━━━━━━━━━━━━━━━━━━━━━━━━━━━
⚙️ SETTINGS
🕐 SESSION TIMES
→ Toggle each session ON/OFF with one click
→ All sessions enabled by default
📦 ORB BOX
→ Show/Hide the Opening Range Box
→ Enable/Disable the Neon Glow effect
→ Hover over settings for detailed info
🏷️ LABELS
→ Size: tiny, small, normal, large, huge
→ Height: Distance above candles (ATR based)
→ Transparency: 0% (solid) → 80% (subtle)
📊 DASHBOARD
→ Live NY time display
→ Shows active session
→ Market status indicator
→ Moveable to any corner
🎨 NEON COLORS
→ Fully customizable
→ Default: Cyan/Red theme
━━━━━━━━━━━━━━━━━━━━━━━━━━━━━━━━━━━━━━━━━━━━━━
🔔 ALERTS
- 🌙 Premarket Start
- 🔔 US Market Open
- 🌃 After Hours Start
Never miss a session change again.
━━━━━━━━━━━━━━━━━━━━━━━━━━━━━━━━━━━━━━━━━━━━━━
💡 PRO TIPS
1. Use ORB breakouts as entry signals
2. Avoid trading during Lunch (low volume = choppy)
3. Best moves happen at US Open and Afternoon
4. Premarket shows overnight sentiment
5. Combine with your favorite strategy
━━━━━━━━━━━━━━━━━━━━━━━━━━━━━━━━━━━━━━━━━━━━━━
Because good trading deserves good design. ✨
Made with 🔥 by R4D1
Part of the NEW AGE indicator collection.
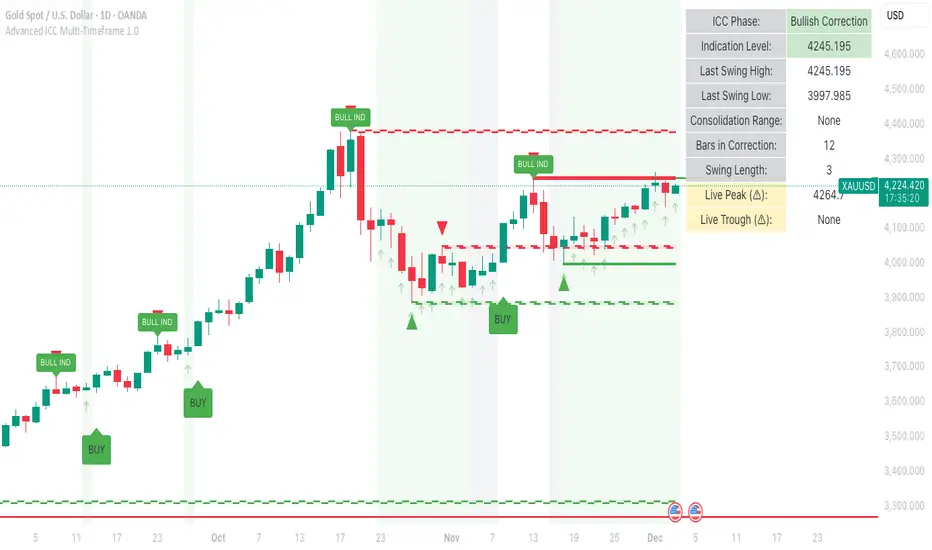
Advanced ICC Multi-Timeframe 1.0Advanced ICC Multi-Timeframe Trading System
A comprehensive implementation and interpretation of the Indication, Correction, Continuation (ICC) trading methodology made popular by Trades by Sci, enhanced with advanced multi-timeframe analysis and automation features.
⚠️ CRITICAL TRADING WARNINGS:
DO NOT blindly follow BUY/SELL signals from this indicator
This indicator shows potential entry points but YOU must validate each trade
PAPER TRADE EXTENSIVELY before risking real capital
BACKTEST THOROUGHLY on your chosen instruments and timeframes
The ICC methodology requires understanding and discretion - automated signals are guidance only
This tool aids analysis but does not replace proper trade planning, risk management, or trader judgment
⚠️ Important Disclaimers:
This indicator is not endorsed by or affiliated with Trades by Sci
This is an early implementation and interpretation of the ICC methodology
May not work exactly as Trades by Sci executes his trades and entries
Requires further debugging, backtesting, and real-world validation
Completely free to use - no purchase required
I'm just one person obsessed with this method and wanted some better visualization of the chart/entries
About ICC:
The ICC method identifies complete market cycles through three phases: Indication (breakout), Correction (pullback), and Continuation (entry). This indicator automates the identification of these phases and adds powerful features for modern traders.
Key Features:
Multi-Timeframe Capabilities:
Automatic timeframe detection with optimized settings for 5m, 15m, 30m, 1H, 4H, and Daily charts
Higher timeframe overlay to view HTF ICC levels on lower timeframe charts for precise entry timing
Smart defaults that adjust swing length and consolidation detection based on your timeframe
Advanced Phase Tracking:
Complete ICC cycle tracking: Indication, Correction, Consolidation, Continuation, and No Setup phases
Live structure detection shows potential peaks/troughs before full confirmation
Intelligent invalidation logic detects failed setups when market structure reverses
Dynamic phase backgrounds for instant visual confirmation
Three Types of Entry Signals:
Traditional Entries - Price crosses back through the original indication level (strongest signals)
"BUY" (green) / "SELL" (red)
Breakout Entries - Price breaks out of consolidation range in the same direction
"BUY" (green) / "SELL" (red)
Reversal Entries (Optional, can be toggled off) - Price breaks consolidation in opposite direction, indicating failed setup
"⚠ BUY" (yellow) / "⚠ SELL" (orange)
More aggressive, counter-trend signals
Can be disabled for more conservative trading
Professional Features:
Volatility-based support/resistance zones (ATR-adjusted) that adapt to market conditions
Historical zone tracking (0-3 configurable) with visual hierarchy
Comprehensive real-time info table displaying all key metrics
Full alert system for entries, indications, and consolidation detection
Visual distinction between high-confidence trend entries and cautionary reversal entries
📖 USAGE GUIDE
Entry Signal Types:
The indicator provides three types of entry signals with visual distinction:
Strong Entries (High Confidence):
"BUY" (bright green) / "SELL" (bright red)
Includes traditional entries (crossing back through indication level) and breakout entries (breaking consolidation in trend direction)
These are trend continuation or breakout signals with higher probability
Recommended for all traders
Reversal Entries (Caution - Counter-Trend):
"⚠ BUY" (yellow) / "⚠ SELL" (orange)
Triggered when price breaks out of correction/consolidation in the OPPOSITE direction
Indicates a failed setup and potential trend reversal
More aggressive, counter-trend plays
Can be toggled off in settings for more conservative trading
Recommended only for experienced traders or after thorough backtesting
Swing Length Settings:
The swing length determines how many bars on each side are needed to confirm a swing high/low. This is the most important setting for tuning the indicator to your style.
Auto Mode (Recommended for beginners): Toggle "Use Auto Timeframe Settings" ON
5-minute: 30 bars
15-minute: 20 bars
30-minute: 12 bars
1-hour: 7 bars
4-hour: 5 bars
Daily: 3 bars
Manual Mode: Toggle "Use Auto Timeframe Settings" OFF
Lower values (3-7): More aggressive, detects smaller swings
Pros: More signals, faster entries, catches smaller moves
Cons: More noise, more false signals, requires tighter stops
Best for: Scalping, active day trading, volatile markets
Higher values (12-20): More conservative, only major swings
Pros: More reliable signals, fewer false breakouts, clearer structure
Cons: Fewer signals, delayed entries, might miss smaller opportunities
Best for: Swing trading, position trading, trending markets
Default Manual Setting: 7 bars (balanced for 1H charts)
Minimum: 3 bars
Consolidation Bars Setting:
Determines how many bars without new structure are needed before flagging consolidation.
Lower values (3-10): Faster detection, catches brief pauses, more sensitive
Best for: Lower timeframes, volatile markets, avoiding any chop
Higher values (20-40): More reliable, only flags true extended consolidation
Best for: Higher timeframes, trending markets, patient traders
Current defaults scale with timeframe (more bars needed on shorter timeframes)
Historical S/R Zones:
Shows previous support and resistance levels to provide context.
Default: 2 historical zones (shows current + 2 previous)
Range: 0-3 zones
Visual Hierarchy: Older zones are more transparent with dashed borders
Usage: Higher numbers (2-3) show more historical context but can clutter the chart. Start with 2 and adjust based on your preference.
Live Structure Feature (Yellow Warning ⚠):
Provides early warning of potential structure changes before full confirmation.
What it does: Detects potential swing highs/lows after just 2 bars instead of waiting for full swing_length confirmation
Live Peak: Shows when a high is followed by 2 lower closes (potential top forming)
Live Trough: Shows when a low is followed by 2 higher closes (potential bottom forming)
Important: These are UNCONFIRMED - they may be invalidated if price reverses
Use case: Get early awareness of potential reversals while waiting for confirmation
Displayed in: Info table only (no visual markers on chart to reduce clutter)
Only shows: Peaks higher than last swing high, or troughs lower than last swing low (filters out noise)
Higher Timeframe (HTF) Analysis:
View higher timeframe ICC structure while trading on lower timeframes.
How to enable: Toggle "Show Higher Timeframe ICC" ON
Setup: Set "Higher Timeframe" to your reference timeframe
Example: Trading on 15-minute? Set HTF to 240 (4-hour) or 60 (1-hour)
Example: Trading on 5-minute? Set HTF to 60 (1-hour) or 15 (15-minute)
What it shows:
HTF indication levels displayed as dashed lines
Blue = HTF Bullish Indication
Purple = HTF Bearish Indication
HTF phase and levels shown in info table
Trading workflow:
Check HTF phase for overall market direction
Wait for HTF correction phase
Drop to lower timeframe to find precise entries
Enter when lower TF shows continuation in alignment with HTF
Best practice: HTF should be 3-4x your trading timeframe for best results
Reversal Entries Toggle:
Default: ON (shows all signal types)
Toggle OFF for more conservative trading (only trend continuation signals)
Recommended: Backtest with both settings to see which works better for your style
New traders should consider disabling reversal entries initially
Volatility-Based Zones:
When enabled, support/resistance zones automatically adjust their height based on ATR (Average True Range).
More volatile = wider zones
Less volatile = tighter zones
Toggle OFF for fixed-width zones
Community Feedback Welcome:
This is an evolving project and your input is valuable! Please share:
Bug reports and issues you encounter
Feature requests and suggestions for improvement
Results from your backtesting and live trading experience
Feedback on the reversal entry feature (too aggressive? working well?)
Ideas for better aligning with the ICC methodology
Perfect for traders learning or implementing the ICC methodology with the benefit of modern automation, multi-timeframe analysis, and flexible entry signal options.
Gold-to-GDX Flow Ratio (Metal vs Miners)# 📊 Indicator: Gold/GDX Flow Ratio (Metal vs Miners)
🔎 What it does
This indicator tracks the **relative flow of capital between gold and gold miners (GDX ETF)**. By plotting the ratio of gold price to GDX, it shows whether investors are favoring the **metal itself** or the **equities that mine it**.
- **Ratio rising:** Flow favors gold (metal > miners).
- **Ratio falling:** Flow favors miners (miners > metal).
- **Crossovers:** Fast/slow EMA crossovers highlight regime shifts.
- **Z‑score bands:** ±2 standard deviations flag stretched conditions, often precursors to mean reversion.
⚙️ Features
- **Customizable inputs:** Choose spot gold (`XAUUSD`) or futures (`GC1!`), and GDX ETF.
- **Moving averages:** Fast and slow EMAs to define flow regimes.
- **Z‑score overlay:** Detects extremes in the ratio.
- **Alerts:** Triggered on regime flips or exhaustion signals.
- **Prompt flow option:** Displays the current ratio as a clear on‑screen figure for quick read.
🎭 Why it matters
- **Gold vs miners divergence:** Miners often amplify moves in gold, but sometimes decouple. This ratio helps spot those divergences early.
- **Flow diagnostics:** Instead of vague “profit taking” narratives, you see where capital is actually rotating.
- **Tactical entries:** Use resistance/stop‑cluster maps in gold together with this ratio to time miner trades more effectively.
🧭 How to use
1. Add the indicator to your chart.
2. Watch the **ratio trend**: rising = metal strength, falling = miner strength.
3. Use **EMA crossovers** as regime signals.
4. Treat **Z‑score extremes** as caution zones for stretched flows.
5. Combine with your VWAP and resistance overlays for execution discipline.

MACD nothing newThere’s nothing new in this indicator, but I strongly recommend hiding the signal line and the histogram.

MA CrossMA Cross indicator is a multi-MA indicator that saves indicator quota when you need several MAs.

EMA CrossEMA Cross indicator is a multi-EMA indicator that saves indicator quota when you need several EMAs.

FAIRPRICE_VWAP_RDFAIRPRICE_VWAP_RD
This script plots an **anchored VWAP (Volume Weighted Average Price)** that resets
based on the user-selected anchor period. It acts as a dynamic “fair value” line
that reflects where the market has actually transacted during the chosen period.
FEATURES
- Multiple anchor options: Session, Week, Month, Quarter, Year, Decade, Century,
Earnings, Dividends, or Splits.
- Intelligent handling of the “Session” anchor so it works correctly on both 1m
(resets each new day) and 1D (continuous, non-resetting VWAP).
- Manual VWAP calculation using cumulative(price * volume) and cumulative(volume),
ensuring the line is stable and works on all timeframes.
- Optional hiding of VWAP on daily or higher charts.
- Offset input for horizontal shifting if desired.
- VWAP provides a true “fair price” reference for trend, mean-reversion,
and institutional-level analysis.
PURPOSE
This indicator solves the common problem of VWAP behaving incorrectly on higher
timeframes, on synthetic data, or with unusual anchors. By implementing VWAP
manually and allowing flexible reset conditions, it functions reliably as
an institutional-style fair value benchmark across any timeframe.

RSI_RDRSI_RD - RSI Divergence Detector (Ryan DeBraal)
This script plots a standard RSI along with advanced automatic divergence detection.
It identifies four types of divergences using pivot logic and configurable
lookback windows. Signals appear directly on the RSI line as plotted marks and labels.
FEATURES
- Standard RSI with user-defined length and source.
- Midline (50), overbought (70), and oversold (30) levels with shaded background.
- Automatic detection of:
• Regular Bullish Divergence
• Regular Bearish Divergence
• Hidden Bullish Divergence
• Hidden Bearish Divergence
- Each divergence type can be toggled on/off individually.
- Pivot-based detection using left/right lookback lengths.
- Range filter (bars since pivot) to avoid stale or invalid divergences.
- Colored markers and labels placed exactly on pivot points.
- Alerts for all four divergence conditions.
PURPOSE
This indicator makes RSI divergence trading systematic and visual.
It highlights when price action disagrees with RSI momentum — often signaling
exhaustion, reversal setups, or continuation opportunities depending on the divergence type.
Ideal for combining with trend filters, VWAP, or ORB structures.

Quantrader📊 Overview
This custom indicator combines intraday session analysis with multi-timeframe trend confirmation to identify high-probability trading opportunities. It features:
Custom intraday session tracking (GMT+7 timezone)
Multi-level moving average confluence (SMA 20, 100, 200)
Bollinger Bands mean reversion signals
Key intraday reference levels
⚙️ Core Components
1. Custom Intraday Session Tracking
Session Start: 7:00 AM GMT+7 (Vietnamese market open)
Calculates per session:
Intraday High/Low (resets at 7:00 AM daily)
Intraday Midline = (Session High + Session Low) / 2
Pre-Day Center = Previous day's midline (carried forward)
Open Day = First 15-minute candle's open price
2. Trend Analysis Framework
SMA 20 (Short-term momentum)
SMA 100 (Medium-term trend)
SMA 200 (Long-term trend direction)
Bollinger Bands (20-period, 2 standard deviations)
3. Signal Detection Logic
Bullish Mean Reversion Setup:
javascript
Condition 1: Green candle closes ABOVE Upper Bollinger Band
Condition 2: Following candle is ALSO green
→ Triggers: Green highlight + Triangle below bar
Bearish Mean Reversion Setup:
javascript
Condition 1: Red candle closes BELOW Lower Bollinger Band
Condition 2: Following candle is ALSO red
→ Triggers: Red highlight + Triangle above bar
🎯 Visual Elements
Element Color Description
Intraday Midline Blue Real-time session midpoint
Pre-Day Center Yellow Yesterday's midline (reference)
Open Day Purple (dashed) Day's opening price
SMA 20 Red Short-term trend
SMA 100 Green Medium-term trend
SMA 200 Orange Long-term trend
Bollinger Bands Red/Green/Blue Volatility boundaries
Bull Signal Green triangle ↓ Oversold bounce potential
Bear Signal Red triangle ↑ Overbought rejection potential
📈 Trading Applications
1. Trend Confirmation
Bullish Alignment: Price > All SMAs + Above Intraday Midline
Bearish Alignment: Price < All SMAs + Below Intraday Midline
2. Mean Reversion Opportunities
Overbought Scenario: Consecutive green candles above Upper BB → Potential reversal
Oversold Scenario: Consecutive red candles below Lower BB → Potential bounce
3. Intraday Level Trading
Intraday Midline: Dynamic support/resistance
Pre-Day Center: Psychological reference level
Open Day: Key opening price level
⚡ Key Features
Automatic Session Reset: Daily at 7:00 AM GMT+7
Multi-Timeframe Confluence: Combines intraday, daily, and trend analysis
Clean Visual Design: Non-cluttered, focused on key levels
Real-Time Calculation: All levels update with each new candle
🛠️ Recommended Settings
Timeframe: 15-minute to 1-hour charts
Markets: Forex, Indices, Commodities
Best Pairs: EURUSD, XAUUSD, VN30, USDJPY
Trading Style: Swing trading, Day trading
📖 Usage Tips
Trend Trading: Enter in direction of SMA alignment (20 > 100 > 200 for bullish)
Mean Reversion: Use BB signals at key intraday levels (Midline, Pre-Day Center)
Confirmation: Wait for candle close above/below key levels
Risk Management: Place stops beyond opposite intraday extreme
🎨 Customization Options
Users can modify:
Session start time (line 6)
Bollinger Band parameters (length, multiplier)
SMA periods
Color schemes


ADX_RDADX_RD - Average Directional Index (Ryan DeBraal)
This script plots a refined version of the **ADX (Average Directional Index)**,
used to measure trend strength regardless of trend direction. It includes
custom smoothing, modified DM (Directional Movement) logic, dynamic coloring,
and a built-in 20-level threshold.
FEATURES
- Calculates +DI, –DI, and ADX using standard Wilder smoothing (RMA).
- Signal color turns **white** when ADX < 20 (low-trend or choppy conditions).
- Signal color turns **blue** when ADX >= 20 (trend strengthening).
- Horizontal dotted reference line at **20**, a widely used threshold:
ADX < 20 → weak or ranging market
ADX > 20 → strengthening trend
- Works on all timeframes, supports custom smoothing lengths.
PURPOSE
This indicator helps identify when a market is trending vs when it is flat.
It does not indicate direction by itself — only the strength of the move —
making it ideal for confirming breakout setups, trend-following entries,
and filtering out low-probability trades during chop.

ORB_RDORB_RD - Opening Range Box (Ryan DeBraal)
This indicator automatically draws a high/low box for the first portion of
each trading day, automatically stepping the range window from 15, 30, 45,
up to 60 minutes after the session starts. The box updates live as the range
forms, then optionally extends across the rest of the session.
FEATURES
-----------------------------------------------------------------------------
• Opening Range Detection
- Automatically ladders the range window: 0–15, 0–30, 0–45, 0–60 minutes
- Automatic reset at each new trading day
- Live high/low updates while inside the 0–60 minute window
• Auto-Drawing Range Box
- Draws a dynamic rectangle as the range forms
- Top and bottom update with every new high/low
- Extends sideways in real time during formation
- Optional full-day extension after the 60-minute range finalizes
• Customizable Visuals
- Adjustable fill transparency
- Mild green tint by default for clarity
PURPOSE
-----------------------------------------------------------------------------
This tool highlights the evolving opening range, a widely used intraday
reference for breakout traders, mean-reversion setups, and session structure
analysis. Ideal for:
• Identifying early support and resistance
• Framing breakout and pullback decisions
• Tracking intraday trend bias after the morning range

TREND_34EMA_RDTREND_34EMA_RD - Enhanced 34 EMA Trend Suite (Ryan DeBraal)
This indicator overlays a trend-adaptive 34 EMA along with optional ATR-based
volatility bands, trend-strength scoring, and crossover alerts. It is built
to give a clean, fast visual read on the current trend direction, volatility,
and momentum quality.
FEATURES
-----------------------------------------------------------------------------
• Core 34 EMA Trend Line
- Standard EMA calculation (default length 34)
- Aqua coloring for clean visibility
- Adjustable line thickness
• ATR-Based Volatility Bands
- Upper and lower bands derived from ATR
- Adjustable ATR length and multiplier
- Optional shaded channel for volatility visualization
- Helps identify trend stability and over-extension
• Trend Strength Score
- Measures slope of the EMA over a lookback window
- Normalizes slope using ATR for consistency across markets
- Outputs a 0–100 score
- Auto-updating label placed at the latest bar
• Gray for weak trend
• Orange for moderate trend
• Green for strong trend
• Optional Crossover Signals
- Detects when price crosses above or below the EMA
- Can display arrows on the chart
- Built-in alert conditions
PURPOSE
-----------------------------------------------------------------------------
This suite provides a clean, minimalistic way to monitor directional bias,
volatility, and trend quality. Ideal for:
• Identifying early trend shifts
• Confirming trend continuation
• Filtering trades based on trend strength
• Detecting over-extension using volatility bands

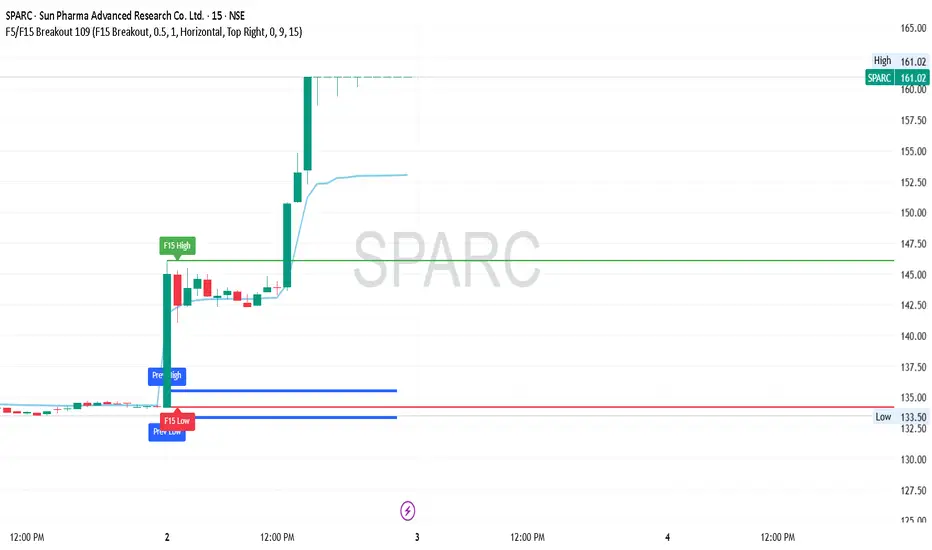
F5/F15 Breakout High and Low Mark by MDHi This scirpt will mark Previous day high and low and current day 5 Mint and 15 Mint according to your requirement it will mark and show you the Buy signal according to that
MACD_RDMACD_RD - Moving Average Convergence Divergence (Ryan DeBraal)
This indicator plots a standard MACD along with a color-adaptive histogram and
integrated momentum-shift alerts. It preserves the normal MACD structure while
improving visual clarity and signal recognition.
FEATURES
-----------------------------------------------------------------------------
• Standard MACD Calculation
- Fast MA (12 by default)
- Slow MA (26)
- Signal line (9)
- Choice between SMA/EMA for both MACD and Signal smoothing
• Color-Changing Histogram
- Green shades for positive momentum
- Red shades for negative momentum
- Lighter/darker tones depending on whether momentum is increasing or fading
- 50% opacity for improved readability
• Crossover-Based MACD Line Coloring
- MACD line turns green on bullish cross (MACD > Signal)
- MACD line turns red on bearish cross (MACD < Signal)
- Default blue when no crossover occurs
• Momentum-Shift Alerts
- Alerts when histogram flips direction
PURPOSE
-----------------------------------------------------------------------------
This MACD version emphasizes momentum shifts and trend transitions by
highlighting subtle histogram changes and providing clean crossover visuals.
Ideal for:
• Identifying early momentum reversals
• Filtering breakout/trend setups
• Confirming trend continuation vs exhaustion

New Age MACD █ NEW AGE MACD 🚀
It's 2025. We're still using indicators from the 90s... but who says they have to LOOK like the 90s? 😎
Traders deserve beautiful tools. Clean aesthetics. Modern vibes. Welcome to the New Age.
Based on CM_MacD_Ult_MTF by ChrisMoody - now reimagined with stunning neon visuals, dynamic glow effects, and an interface that actually looks good on your chart.
Same powerful MACD logic. Fresh new drip. ✨
█ FEATURES ✨
🔮 Neon Line Glow - MACD line glows dynamically based on trend
⚡ Multi-Timeframe - View any timeframe MACD on your current chart
🎯 4-Color Histogram - Gradient colors show momentum strength
🔀 Smart Fill - Beautiful fill between MACD & Signal
🔵 Cross Markers - Visual dots at bullish/bearish crossovers
📋 Elegant Dashboard - Real-time stats with cyan frame design
█ GLOW EFFECT ✨
The signature feature - a beautiful neon glow surrounding the MACD line:
💡 5 transparent layers create a smooth gradient glow
💡 Color follows trend direction automatically
💡 No chart scaling issues - glow follows the line perfectly
🟢 MACD > Signal → Cyan neon glow
🔴 MACD < Signal → Red neon glow
█ HISTOGRAM COLORS 📊
4 colors show momentum state at a glance:
| State | Color | Meaning |
|--------------------|---------------|----------------------|
| Above zero + rising | 🟢 Cyan bright | Strong bullish |
| Above zero + falling| 🟢 Cyan dim | Bullish but fading |
| Below zero + falling| 🔴 Red bright | Strong bearish |
| Below zero + rising | 🔴 Red dim | Bearish but recovering|
█ SIGNALS 🎯
🟢 Bull Cross → MACD crosses above Signal line
🔴 Bear Cross → MACD crosses below Signal line
🟢 Above Zero → MACD crosses above zero line
🔴 Below Zero → MACD crosses below zero line
█ SOURCE SETTINGS ⚙️
Choose the correct source for your chart type:
📊 NORMAL CANDLES:
Source: close (default)
✓ Standard closing price
✓ Most accurate readings
📊 HEIKIN ASHI CANDLES:
Source: ohlc4
✓ Formula: (Open + High + Low + Close) / 4
✓ Smoother MACD line
✓ Fewer false signals
💡 Quick Guide:
Normal Candles → close
Heikin Ashi → ohlc4
█ SETTINGS 🛠️
Timeframe:
⏰ Use Current Chart Resolution
🕐 Use Different Timeframe (MTF)
MACD Settings:
📈 Fast Length (default: 12)
📉 Slow Length (default: 26)
📊 Signal Length (default: 9)
Display Options:
📈 Show MACD & Signal Line
🔵 Show Dots at Cross
📊 Show Histogram
🔀 Show Fill Between MACD & Signal
✨ Show MACD Line Glow
🎨 MACD Color Change on Cross
🎨 Histogram 4 Colors
📋 Show Dashboard
█ DASHBOARD 📋
Elegant dark theme with cyan frame:
| Field | Description |
|-----------|------------------------------------|
| Value | Current MACD value |
| Signal | Signal line value |
| Histogram | MACD minus Signal |
| Zone | Strong Bull / Bullish / Bearish / Strong Bear |
| Trend | Bullish / Bearish |
| Momentum | Strong Up / Fading / Recovering / Strong Down |
| Signal | Current crossover status |
█ RECOMMENDED SETTINGS 📈
| Style | Chart | Source | Fast/Slow/Sig |
|------------------|-----------|--------|---------------|
| Scalping | Normal | close | 8 / 17 / 9 |
| Day Trading | Normal | close | 12 / 26 / 9 |
| Swing Trading | Heikin Ashi| ohlc4 | 12 / 26 / 9 |
| Position Trading | Heikin Ashi| ohlc4 | 19 / 39 / 9 |
█ ALERTS 🔔
🟢 MACD Bullish Cross
🔴 MACD Bearish Cross
🟢 MACD Above Zero
🔴 MACD Below Zero
█ USAGE TIPS 💡
📈 Quick Trend: Look at glow color for instant trend read
📊 Momentum: Watch histogram color transitions
🔍 Divergence: Compare price action with MACD peaks
⏰ Confluence: Use MTF for higher timeframe confirmation
█ COLOR SCHEME 🎨
| Element | Bullish | Bearish |
|------------|-----------|-----------|
| MACD Line | 🔵 Cyan | 🔴 Red |
| Glow | 🔵 Cyan | 🔴 Red |
| Histogram | 🔵 Cyan | 🔴 Red |
| Fill | 🔵 Cyan | 🔴 Red |
| Signal | ⚪ White | ⚪ White |
| Dashboard | 🔵 Cyan frame | 🔵 Cyan frame |
█ CREDITS 👏
Original concept: CM_MacD_Ult_MTF by ChrisMoody
Enhanced version: New Age MACD by RadisaBTC
If you find this indicator useful, please leave a 👍 and follow for more updates!
Because good trading deserves good design. 💎
Happy Trading! 🚀📈

Watchlist Volume Surge AlertOverview
This indicator is designed for traders who monitor large watchlists and need instant notification when a stock is experiencing unusual volume activity relative to its recent history.
Standard volume indicators often include the current day's volume in the average calculation. This causes a problem: if a stock is having a massive breakout, that high volume pulls the average up immediately, making it harder to hit the "relative" threshold.
This script solves that by comparing the current volume against the Simple Moving Average (SMA) of the previous n bars. This ensures a clean baseline and accurate alerts, even during massive volatility.
Key Features
Smart RVOL Calculation: Calculates Relative Volume (RVOL) based on the previous 30 bars (adjustable), ensuring the current breakout doesn't skew the average.
Visual Clarity:
Bars: Normal volume is transparent. Surge volume turns bright Teal (Bullish Close) or Red (Bearish Close).
Background: The indicator panel background highlights when a surge is active, making it impossible to miss when scanning visually.
Data Window: Displays the exact RVOL ratio (e.g., 2.11) in the Data Window for verification.
Watchlist Alert Optimized: Specifically designed to work with TradingView's "Any alert function call" or standard condition alerts across multiple tickers.
How to Set Up Alerts
This script is perfect for setting a single alert on a large watchlist to catch breakouts as they happen.
Add the indicator to your chart.
Go to the Alerts menu and create a new alert.
Condition: Select Watchlist Volume Surge Alert.
Trigger: Select "Once Per Bar".
Note: Using "Once Per Bar" ensures you are notified the moment the volume crosses the threshold during the trading day, rather than waiting for the market to close.
Message: The script includes a dynamic message: "Volume Surge! {{ticker}} volume is {{plot("RVOL Ratio")}}x the average."
Settings
Average Length (Days): The lookback period for the volume average (Default: 30).
Alert Threshold (x Average): The multiple required to trigger an alert (Default: 1.5x).
Note: This works better when you have a watchlist with similar volatility and/or market cap

Multi-Tool VWAP + EMAs (Multi-Timeframe) + Key LevelsDescription
This indicator combines several commonly used technical analysis tools into a single script, especially useful for traders using the free version of TradingView or anyone looking to reduce the number of indicators on their chart.
The goal is to provide clear visual references for trend, structure, and key levels—without generating buy/sell signals or automated trading functions.
Included Features
1. VWAP (session-anchored)
Source: HLC3
Purple line, thickness 2
Useful as a reference for daily institutional average price.
2. EMAs of the current timeframe
EMA 200 (red, thickness 3)
EMA 9 (green, thickness 1)
These EMAs help visualize long-term trend and short-term momentum.
3. Dynamic EMAs (MTF – Multi-Timeframe)
The indicator displays the 200 EMA from higher timeframes as dynamic horizontal levels:
5 minutes
15 minutes
30 minutes
1 hour
4 hours
1 day
Each level includes a descriptive label such as “15 min EMA 200”.
These EMAs serve as reference points for potential support/resistance areas coming from higher timeframes.
4. Automatic Key Levels
The indicator plots several important price levels:
Previous day:
PDH (Previous Day High)
PDL (Previous Day Low)
Previous Day 50% Fibonacci level
Pre-market (04:00–09:30 exchange time):
PMH (Pre-Market High)
PML (Pre-Market Low)
Current session:
Open (session opening price)
Previous Close (prior day’s closing price)
Purpose and Scope
This script is designed to provide basic visual reference points to support discretionary analysis.
It does not generate signals or trading suggestions, and it is not intended to predict future price movements.
How to Use It
Enable or disable each block in the Inputs section according to your analysis style.
Observe how the levels, EMAs, and VWAP interact with market structure.
Use it as a visual complement to your personal technical analysis.
Limitations
This indicator is not a trading system and does not guarantee results.
It does not include alerts, backtesting, or entry/exit logic.
Some values (such as PMH/PML) depend on the symbol’s exchange trading hours.
Credits
Designed as an educational and analytical tool for traders seeking to simplify their charts without losing key information.
