Indicators, Strategies and Libraries
Enhance your trading decisions with the Rolling Point of Control (POC) Indicator designed by AlgoAlpha! This powerful tool displays a dynamic Point of Control based on volume or price profiles directly on your chart, providing a vivid depiction of dominant price levels according to historical data. 🌟📈 🚀 Key Features: Profile Type Selection: Choose between...
Library "moving_poc" method getMovingPoc(averagePriceByVolumeHistory, ltfVolumeSerie, ltfPriceSerie, nbBarsToLookback) Volume point of control (PoC) extracted from lower time frame data and previous time period Namespace types: array Parameters: averagePriceByVolumeHistory (array) : An array of float to record previous PoC average ...
This indicator provides a high-resolution and high-precision implementation of Volume Profile with flexible range settings. Its key features include: 1. Support for a high resolution of up to 2,500 rows. 2. Capability to examine lower timeframe bars (default 5,000 intra-bars) for enhanced precision. 3. Three range modes — "Visible Range", "Anchored Range", and...
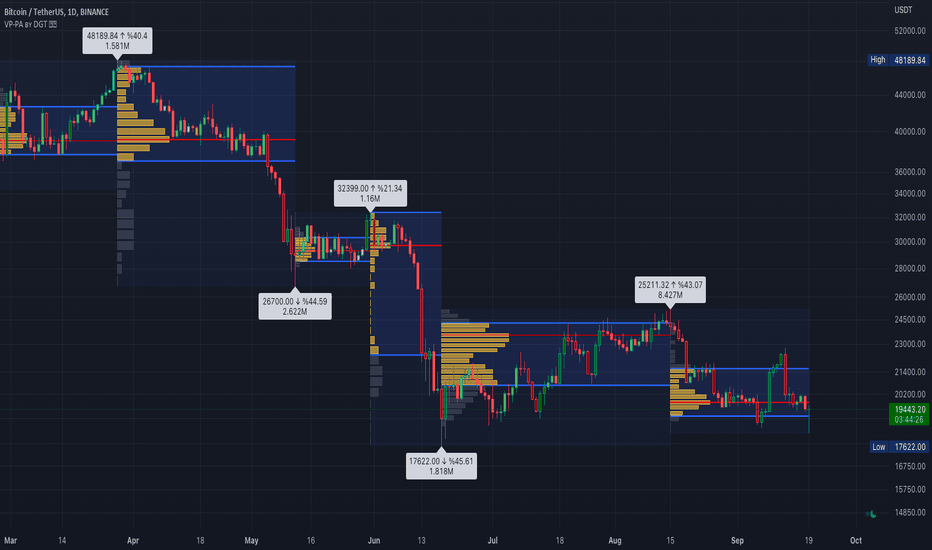
█ Overview The Price & Volume Profile provides a holistic perspective on market dynamics by simultaneously tracking price action and trading volume across a range of price levels. So it is not only a volume-based indicator but also a price-based one. In addition to illustrating volume distribution, it quantifies how frequently the price has fallen within a...
Linear Regression Volume Profile plots the volume profile fixated on the linear regression of the lookback period rather than statically across y = 0. This helps identify potential support and resistance inside of the price channel. Settings Linear Regression Linear Regression Source: the price source in which to sample when calculating the linear...
The vPOC or volume point of control shows where most of the volume was traded. This is important because this is where the institutions and market makers have opened their positions, and these are the ones that move the markets! This indicator is designed to cut through the volume noise, and enable the hiding of lower volume data. The main setting allows you to...
What are TPOC & VPOC? TPOC (time point of control) and VPOC (volume point of control) are points in price where highest amount of time/volume was traded. This is considered key information in a market profile, as it shows where market participant interest was highest. Unlike full fledged market profile that shows total time/volume distribution, this script shows...
The genesis of this project was to create a POC library that would be available to deliver volume profile information via pine to other scripts of indicators and strategies. This is a republish of an invite only script to open access This is the indicator version of the library function. A few points of significance: - Allows the choice of reset of the study...
This indicator with an unfortunate and very non PC sounding name approximates (!) the intrabar point of control (POC) either from time or volume at price. Due to pine limitations, bin size and the sample lower time frame selection will have at least some effect on the accuracy of the approximation. The trade off is between accuracy and historical availability,...
Volume Profile (also known as Price by Volume ) is an charting study that displays trading activity over a specified time period at specific price levels. It is plotted as a horizontal histogram on the finacial isntrumnet's chart that highlights the trader's interest at specific price levels. Specified time period with Pivots Anchored Volume Profile is...
I have recently made a High Timeframe POC script (HFT POC) which is pretty popular. Thanks for this! There are many requests to include lower timeframes in this script, that is why I created this script. I could have incorporated all the timeframe POC's into one indicator but I went this route to keep things more organized between all the different timeframes....
Because the big Bitcoin crash I have been looking a lot at high timeframe metrics. I never spent much time learning POC so I decided to create a little script for determining these on higher timeframes. Currently included: Monthly, 3 months and 6 months. /* DEFINITION */ Point Of Control (= POC) is a price level at which the heaviest volumes were traded. Value...
Displays the estimate of a volume profile, with the option to show a rolling POC (point of control). Users can change the lookback, row size, and various visual aspects of the volume profile. Settings Basic: Lookback: Number of most recent bars to use for the calculation of the volume profile Row Size: Determines the number of rows used for the...
This indicator shows POC (Point of Control) and VA (Value Area) High and Low as well as the developing ranges. This indicator makes use of the new arrays which means the resolution for calculating POC and VA is up to 100k bins at, in most cases, tick resolution and allows for custom time-frames. Not much else needs to be said about this indicator. Happy Trading Hancock
This study tries to recreate session based historic VPoCs and VPVR Volume Profile as they are used by TradingLatino TradingView user. It's aimed at BTCUSDT pair and 4h timeframe. HOW IT WORKS HOW IT WORKS - VPVR Profile Block It gathers volume from the last chosen Bars in order to draw the vpvr profile block Volume that intersects with current level...
Volume Profile Free Ultra SLI by RagingRocketBull 2019 Version 1.0 This indicator calculates Volume Profile for a given range and shows it as a histogram consisting of 100 horizontal bars. This is basically the MAX SLI version with +50 more Pinescript v4 line objects added as levels. It can also show Point of Control (POC), Developing POC, Value Area/VWAP StdDev...
Volume Profile Free MAX SLI by RagingRocketBull 2019 Version 1.0 All available Volume Profile Free MAX SLI versions are listed below (They are very similar and I don't want to publish them as separate indicators): ver 1.0: style columns implementation ver 2.0: style histogram implementation ver 3.0: style line implementation This indicator calculates Volume...
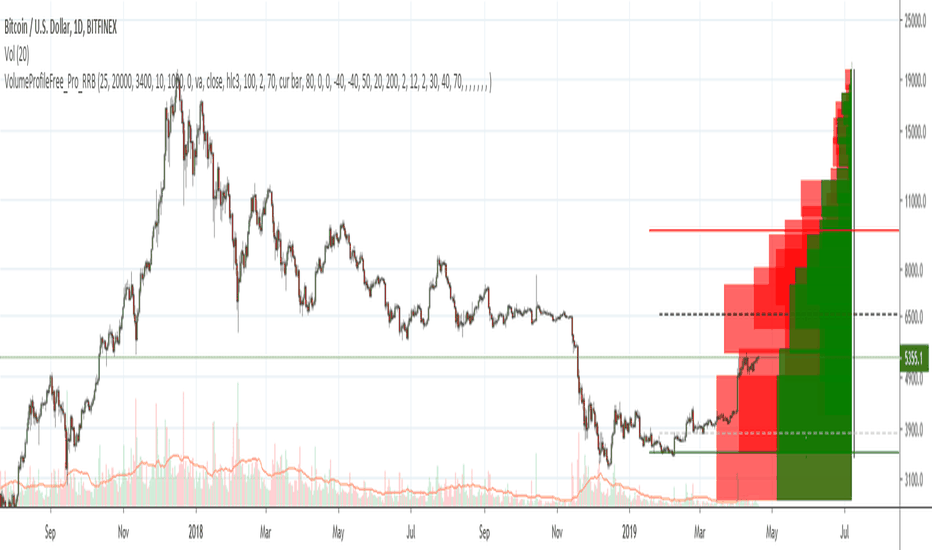
Volume Profile Free Pro by RagingRocketBull 2019 Version 1.0 All available Volume Profile Free Pro versions are listed below (They are very similar and I don't want to publish them as separate indicators): ver 1.0: style columns implementation ver 2.0: style histogram implementation ver 3.0: style line implementation This indicator calculates Volume Profile...
![Rolling Point of Control (POC) [AlgoAlpha] SPX: Rolling Point of Control (POC) [AlgoAlpha]](https://s3.tradingview.com/f/fy2QqfLG_mid.png)


![Volume Profile [LuxAlgo] BTCUSD: Volume Profile [LuxAlgo]](https://s3.tradingview.com/5/5MggSfGG_mid.png)


