HTF Candles with PVSRA Volume Coloring (PCS Series)This indicator displays higher timeframe (HTF) candles using a PVSRA-inspired color model that blends price and volume strength, allowing traders to visualize higher-timeframe activity directly on lower-timeframe charts without switching screens.
OVERVIEW
This script visualizes higher-timeframe (HTF) candles directly on lower-timeframe charts using a custom PVSRA (Price, Volume & Support/Resistance Analysis) color model.
Unlike standard HTF indicators, it aggregates real-time OHLC and volume data bar-by-bar and dynamically draws synthetic HTF candles that update as the higher-timeframe bar evolves.
This allows traders to interpret momentum, trend continuation, and volume pressure from broader market structures without switching charts.
INTEGRATION LOGIC
This script merges higher-timeframe candle projection with PVSRA volume analysis to provide a single, multi-timeframe momentum view.
The HTF structure reveals directional context, while PVSRA coloring exposes the underlying strength of buying and selling pressure.
By combining both, traders can see when a higher-timeframe candle is building with strong or weak volume, enabling more informed intraday decisions than either tool could offer alone.
HOW IT WORKS
Aggregates price data : Groups lower-timeframe bars to calculate higher-timeframe Open, High, Low, Close, and total Volume.
Applies PVSRA logic : Compares each HTF candle’s volume to the average of the last 10 bars:
• >200% of average = strong activity
• >150% of average = moderate activity
• ≤150% = normal activity
Assigns colors :
• Green/Blue = bullish high-volume
• Red/Fuchsia = bearish high-volume
• White/Gray = neutral or low-volume moves
Draws dynamic outlines : Outlines update live while the current HTF candle is forming.
Supports symbol override : Calculations can use another instrument for correlation analysis.
This multi-timeframe aggregation avoids repainting issues in request.security() and ensures accurate real-time HTF representation.
FEATURES
Dual HTF Display : Visualize two higher timeframes simultaneously (e.g., 4H and 1D).
Dynamic PVSRA Coloring : Volume-weighted candle colors reveal bullish or bearish dominance.
Customizable Layout : Adjust candle width, spacing, offset, and color schemes.
Candle Outlines : Highlight the forming HTF candle to monitor developing structure.
Symbol Override : Display HTF candles from another instrument for cross-analysis.
SETTINGS
HTF 1 & HTF 2 : enable/disable, set timeframes, choose label colors, show/hide outlines.
Number of Candles : choose how many HTF candles to plot (1–10).
Offset Position : distance to the right of the current price where HTF candles begin.
Spacing & Width : adjust separation and scaling of candle groups.
Show Wicks/Borders : toggle wick and border visibility.
PVSRA Colors : enable or disable volume-based coloring.
Symbol Override : use a secondary ticker for HTF data if desired.
USAGE TIPS
Set the indicator’s visual order to “Bring to front.”
Always choose HTFs higher than your active chart timeframe.
Use PVSRA colors to identify strong momentum and potential reversals.
Adjust candle spacing and width for your chart layout.
Outlines are not shown on chart timeframes below 5 minutes.
TRADING STRATEGY
Strategy Overview : Combine HTF structure and PVSRA volume signals to
• Identify zones of high institutional activity and potential reversals.
• Wait for confirmation through consolidation or a pullback to key levels.
• Trade in alignment with dominant higher-timeframe structure rather than chasing volatility.
Setup :
• Chart timeframe: lower (5m, 15m, 1H)
• HTF 1: 4H or 1D
• HTF 2: 1D or 1W
• PVSRA Colors: enabled
• Outlines: enabled
Entry Concept :
High-volume candles (green or red) often indicate market-maker activity , such zones often reflect liquidity absorption by larger players and are not necessarily ideal entry points.
Wait for the next consolidation or pullback toward a support or resistance level before acting.
Bullish scenario :
• After a high-volume or rejection candle near a low, price consolidates and forms a higher low.
• Enter long only when structure confirms strength above support.
Bearish scenario :
• After a high-volume or rejection candle near a top, price consolidates and forms a lower high.
• Enter short once resistance holds and momentum weakens.
Exit Guidelines :
• Exit when next HTF candle shifts in color or momentum fades.
• Exit if price structure breaks opposite to your trade direction.
• Always use stop-loss and take-profit levels.
Additional Tips :
• Never enter directly on strong green/red high-volume candles, these are usually areas of institutional absorption.
• Wait for market structure confirmation and volume normalization.
• Combine with RSI, moving averages, or support/resistance for timing.
• Avoid trading when HTF candles are mixed or low-volume (unclear bias).
• Outlines hidden below 5m charts.
Risk Management :
• Use stop-loss and take-profit on all positions.
• Limit risk to 1–2% per trade.
• Adjust position size for volatility.
FINAL NOTES
This script helps traders synchronize lower-timeframe execution with higher-timeframe momentum and volume dynamics.
Test it on demo before live use, and adjust settings to fit your trading style.
DISCLAIMER
This script is for educational purposes only and does not constitute financial advice.
SUPPORT & UPDATES
Future improvements may include alert conditions and additional visualization modes. Feedback is welcome in the comments section.
CREDITS & LICENSE
Created by @seoco — open source for community learning.
Licensed under Mozilla Public License 2.0 .
Pvsra

Cycle Theory + Frequency TheoryCycle Theory attempts to predict, through volatility, support/resistance points where the market may reach/reverse a trend. This theory's calculation is based on a reference candle that the user chooses, usually the first candle of the day/week's session. From this point on, if the level is broken upwards or downwards, the 1st Cycle begins with the same distance between the high/low or open/close of the reference candle. From the 2nd Cycle onwards, the size becomes the sum of all the last cycles formed, and so on.
Frequency Theory is similar, but its levels always have the same size as the high/low or open/close of the reference candle.
PVSRA Volume Suite with Volume DeltaPVSRA Volume Suite with Volume Delta
🔹 Overview
This indicator is a Volume Suite that enhances PVSRA (Price, Volume, Support, Resistance Analysis) by incorporating Volume Delta and AI-driven predictive alerts. It is designed to help traders analyze volume pressure, market trends, and price movements with color-coded visualizations.
📌 Key Features
PVSRA Volume Color Coding – Highlights vector candles based on extreme volume/spread conditions.
Volume Delta Analysis – Tracks buying/selling pressure using up/down volume data.
AI-Powered Predictive Alerts – Identifies potential trend shifts based on volume and trend context.
Volatility-Adjusted Thresholds – Dynamically adapts volume conditions based on ATR (Average True Range).
Customizable MA & Symbol Overrides – Allows traders to tweak settings for personalized market insights.
Debug & Diagnostic Labels – Shows statistical z-scores, thresholds, and volume dynamics.
How It Works
PVSRA Color Coding – The script classifies candles into four categories based on volume and spread analysis:
🔴 Red Vector → Extreme bearish volume/spread
🟢 Green Vector → Extreme bullish volume/spread
🟣 Violet Vector → Above-average bearish volume
🔵 Blue Vector → Above-average bullish volume
Volume Delta Calculation – Uses lower timeframe volume analysis to estimate up/down volume differentials.
Trend & Predictive Alerts – Combines EMA crossovers with statistical volume analysis to detect potential trend shifts.
Volatility Adaptation – Adjusts volume thresholds based on ATR, making signals more reliable in changing market conditions.
Custom Symbol Override – Fetches PVSRA data from a different instrument, useful for index-based volume analysis.
Customizable Inputs
PVSRA Color Settings – Modify candle color schemes for better visual clarity.
Volume Delta Colors – Customize delta volume body, wick, and border colors.
AI Settings – Tune z-score thresholds, lookback periods, and enable predictive alerts.
Symbol Overrides – Analyze volume from a different market or asset.
Moving Average (MA) Settings – Display a volume-based moving average for trend confirmation.
Important Notes
Works best on intraday timeframes where volume data is reliable.
Lower timeframe volume delta estimates might not be precise for all assets.
No guarantees of accuracy – Use alongside other confluence tools for decision-making.
Credits & Open-Source Notice
This script is based on PVSRA methodologies and integrates Volume Delta analysis. Special thanks to Traders Reality and TradingView for their contributions to volume-based analysis.

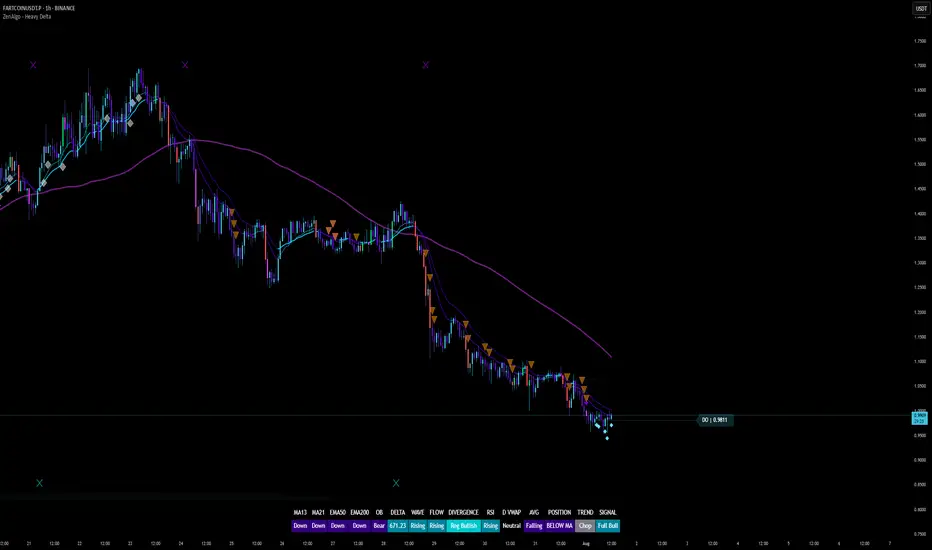
ZenAlgo - DetectorThis script combines multiple volume data sources, calculates several forms of volume-based metrics, displays a table for Spot vs. Perpetual volumes, and visualizes several technical elements (such as cumulative delta, divergences, fractals, and specialized moving averages). The primary objective is to help analyze volume activity across different exchanges, compare Spot vs. Perpetual markets, and observe how shifting volumes may coincide with price action characteristics. This description aims to clarify each component, explain how the calculations are performed, and show you how to interpret the various chart markings.
Why Combine These Metrics in One Script?
Many publicly available volume-related tools focus only on a single exchange or a single type of volume (like spot or futures). This script merges multiple exchange sources for spot and perpetual data into a unified view. By doing so, users can detect discrepancies or confirm alignment between different markets without juggling multiple indicators. It also processes volume-derived signals (delta, divergences, fractals, etc.) in one place, sparing you from manually combining various standalone scripts. Through this integration, it becomes easier to observe how price and volume interact across different market segments.
Core Concept: Aggregated Volume
The script begins by collecting volumes from multiple exchanges in two categories:
Spot volumes – Typically aggregated under symbols ending with "USDT" or a user-selected currency, and
Perpetual volumes – From perpetual futures contracts (e.g., symbols ending in "USD.P" or "USDT.P").
All these exchange volumes are requested via the built-in request.security() function in a single line for each exchange. The user can enable or disable each exchange in the inputs. The script then calculates an "aggregated volume" for Spot, an aggregated volume for Perpetual, and an overall combined total.
This aggregated volume is used later to break down how much of each bar's volume can be considered "buy" or "sell" based on the bar's candle structure (body vs. wicks).
Volume-Based Calculations: Buy vs. Sell Volume and Delta
For each bar, the script estimates how much of the aggregated volume can be associated with a "buy side" and a "sell side."
Volume Buy is computed if the bar's close is above the open , giving more weight to the candle's body and allocating some portion of volume to the wicks as well.
Volume Sell is similarly computed if the bar's close is below the open .
This results in a Delta value: Delta = (Buy Volume) – (Sell Volume).
Additionally, the script accumulates these values over a user-defined "lookback length" to provide Cumulative Delta . This can help show longer-term directional volume bias.
Table: Spot vs. Perpetual Comparison
There is a toggle ("Show Spot vs Perpetual Table") that displays an on-chart table comparing volumes:
Buy Volume and Sell Volume for each aggregated category (Spot, Perp, and their sum).
Delta (the difference between Buy and Sell).
Percentage breakdowns of buy vs. sell portions.
This table only appears on the most recent bar and helps users quickly assess how Spot and Perpetual volumes compare, plus the overall total.
PVSRA Color Coding
A "PVSRA-style" color approach classifies each bar based on volume and candle range:
Climax Up (lime) or Climax Down (red) occurs if volume is extremely high relative to a simple moving average of volume and range.
Above-Average Up (blue) or Down (fuchsia) occurs if volume is moderately higher than average.
Otherwise, colors fall back to neutral up/down colors.
This allows you to spot potentially high-volume "climax" bars vs. bars with only moderate or typical volume levels.
Fractals and Divergences
The script detects certain fractal points on the aggregated volumes (sum of buy or sell volumes). It looks for a 5-bar pattern (with the current bar in the middle for top or bottom fractals).
When a fractal is confirmed on buy volume, the script checks if new higher price highs coincide with lower buy-volume peaks (or vice versa) to highlight regular or hidden divergences.
Similar logic is applied on the sell-volume side if new lower price lows occur alongside higher sell-volume troughs (or the opposite).
If enabled in the settings, lines and labels may appear on the chart to mark these divergence points.
"Delta Dot" Events
This script draws small circles above or below bars when the total delta changes magnitude relative to the previous bar by certain user-defined multipliers. It segregates "tiny," "small," "large," and "extra" expansions in bullish or bearish delta.
Bullish Dots : Appear above the bar when the new positive delta is multiple times bigger than the previous positive delta.
Bearish Dots : Appear below the bar in a similar fashion for negative delta.
These dots emphasize large or sudden shifts in buy/sell pressure from one bar to the next.
Delta MA and its Direction
A moving average is calculated on the total delta and optionally multiplied by a factor (in the code, by 4) to make it visually prominent. The user can pick from SMA, EMA, WMA, RMA, or HMA as the smoothing technique.
Delta MA Direction : The script compares the current delta MA to a short SMA of itself to define whether it is rising or falling.
A color is assigned—blue if rising, orange if falling, gray if they're roughly equal.
This helps quickly visualize longer-term momentum in the net delta metric.
Divergences on the Delta MA
After computing the "Delta MA" line, the script detects pivot highs or lows on that line. If the price makes a new high but the Delta MA pivot is lower (and vice versa), it draws lines and small labels indicating potential divergence.
Bearish Divergence : Price makes a higher high, while the Delta MA pivot forms a lower high.
Bullish Divergence : Price makes a lower low, while the Delta MA pivot forms a higher low.
RSI + MFI Computation
The script also calculates a simplified form of RSI+MFI by comparing (close – open) / (high – low) * a multiplier , then smoothing it with a simple average. This is purely for an optional observational measure to see if the price action is leaning bullish or bearish in terms of these combined indicators.
EMA Overlay and Diamond Shapes
There are two standard EMAs (13 and 21). The script checks whether price is above or below these EMAs, in addition to other conditions (like changes in delta, volume, or RSI+MFI direction) to draw diamond shapes at the top or bottom of the chart:
Green Diamonds near the bottom if the conditions line up to suggest that the environment is more favorable for bullish pressure.
Red Diamonds near the top if the environment suggests more bearish pressure.
These diamonds come in two sizes:
Normal – More pronounced, typically plotted if RSI+MFI result is above/below zero.
Small – Plotted if RSI+MFI is on the other side of that threshold.
An optional "Hardcore Mode" adds special tiny diamonds under specific delta color/condition mismatches.
How to Interpret the Chart Elements
Line Plots of Buy and Sell Volumes : A positive line for buy volume, a negative line for sell volume, and a zero-line for reference. This provides at-a-glance perspective on how buy or sell volumes add up per bar.
Histogram "Total Delta" : A color-coded bar that quickly shows whether overall buy vs. sell volume is dominant. The color is governed by the PVSRA logic (e.g., potential climax or above-average conditions).
Volume Table (when enabled): Summarizes volumes in numeric and percentage form for Spot, Perp, and total categories on the last bar.
Delta Dots : Small circles highlighting abrupt changes in delta magnitude. Larger multiples indicate bigger jumps compared to the previous bar.
Fractals & Divergence Lines : Connect pivot points in buy/sell volume or in the Delta MA line with price highs/lows to indicate potential divergences.
Delta MA Plot : Smooth curve (scaled up x4) to reflect longer-term accumulation or distribution in the delta. Colored by whether the MA is above or below a short average of itself.
Diamonds : Appear when certain volume, price, RSI+MFI, and delta conditions converge. Green diamonds near the bottom typically coincide with bullish conditions, red diamonds near the top with bearish conditions.
Practical Usage Notes
Use the Spot vs. Perp breakdown to see if these two market segments differ significantly in their contributions to total volume. This can be informative when a certain type of market (futures vs. spot) might be "driving" price action.
The PVSRA color scheme highlights "climax" or "above-average" volume bars, which can sometimes appear around major reversals or breakouts.
Observing divergences in aggregated buy/sell volume (or in the Delta MA line) can provide additional context on whether certain price moves are backed by strong volume involvement.
The script's fractal divergences rely on short pivot detection. Signals will appear only after enough bars have passed for confirmation, so these are effectively "after-the-fact" notations to illustrate possible volume/price divergences.
The diamonds do not necessarily instruct any buy/sell action; rather, they mark conditions where multiple volume and momentum criteria line up in one direction.
Important Considerations
This script displays aggregated volumes from potentially multiple exchanges. Each exchange or pair might have different time zones, liquidity, or data availability, which can occasionally result in incomplete or zero values.
All references to "buy" or "sell" volume are approximate breakdowns based on candle structure. They are not absolute measures of real-time order flow.
Divergences and fractal points are provided strictly for analytical insight. They can repaint or shift if the fractal conditions were not fully confirmed in real time.
The color-coded lines, histograms, diamonds, and tables are strictly to guide analysis of volume fluctuations and do not claim to predict future price performance.
If you enable "Hardcore Mode," you will see additional diamond markers. This mode is mainly intended as an extra highlight of certain "contradictory" delta conditions.
Summary
The "ZenAlgo - Detector" script brings together a variety of volume-based analyses:
Aggregated volumes from multiple exchanges
A breakdown into Spot vs. Perpetual activity
Delta calculations, fractal divergences, and a specialized Delta Moving Average
Color-coded bars reflecting possible PVSRA concepts
A table to highlight numeric differences and percentages
Additional overlays (e.g., diamonds, RSI+MFI synergy, etc.)
In contrast to many free, single-exchange indicators, this script centralizes multiple exchange volumes in one place, making it easier to observe and compare volume flows across different market types (spot vs. perpetual). Users no longer need to rely on scattered tools or separate overlays to check volume divergences, fractals, or specialized MA calculations—everything is unified here. By carefully monitoring the table, Delta histogram, color-coded bars, divergence lines, and diamond markers, traders can more comprehensively evaluate how volume and price interact. Each plot is designed to showcase different aspects of volume flow—such as whether spot or derivatives markets dominate, if volume is skewed toward buying or selling, and if there are divergences between volume momentum and price movement.
All computations are displayed to help you carry out a more informed market analysis. It is strongly advised to combine these observations with other risk management or analytical methods, rather than relying on any single indicator alone.

Volume Delta with PVSRAVolume Delta with PVSRA
Volume Delta with PVSRA is an advanced volume indicator that dissects each bar’s volume into its directional components using higher resolution data. It visually distinguishes between buying and selling volume, so that for a bullish candle the bottom portion represents buying volume and for a bearish candle it represents selling volume. A dot is plotted at the 50% mark of the candle’s total volume, serving as a clear reference point.
Key Features:
Directional Volume Breakdown:
The indicator calculates the delta volume by analyzing lower timeframe data. The bottom portion of a bullish candle (displayed in green) represents buying volume, while that of a bearish candle (displayed in red) represents selling volume.
PVSRA Analysis:
Using Price-Volume Spread Range Analysis, the indicator compares the current volume to the 10-bar average. When volume is significantly higher (using thresholds of 150% and 200%), the candle borders are highlighted in custom colors, indicating medium or strong volume conditions.
Volume Moving Averages:
Three moving averages are plotted:
Total Volume MA (yellow): Tracks overall volume.
Buying Volume MA (green) and Selling Volume MA (red): These are re-centered around the total volume MA. A crossover of the green over the red typically signals rising buying pressure, while the opposite indicates increasing selling pressure.
Scalable Volume Bars:
The indicator scales the volume bars to provide optimal visualization on your chart.
Setup Instructions:
For best results, open your chart settings, navigate to the Canvas tab, and set the bottom margin to 0%. This ensures the indicator displays like a standard volume indicator without any unwanted gaps at the bottom.
Customize the various settings—including colors, border opacity, and moving average parameters—to suit your trading style.

ZenAlgo - Heavy DeltaThe ZenAlgo - Heavy Delta indicator is a comprehensive technical analysis tool designed for traders seeking a deeper understanding of market dynamics. It combines multiple advanced sub-indicators, including Order Blocks, Moving Averages, VWAP, and Delta Volume analysis, and more to provide actionable insights. This indicator is particularly useful for identifying potential trade entries and exits based on institutional order flow and price action patterns.
Features
Order Block Detection: Identifies bullish and bearish order blocks with detailed visualization and volume analysis.
VWAP (Volume Weighted Average Price): Tracks the average price of a security weighted by volume over various anchor periods.
Moving Averages (MA): Customizable MAs (13, 21, 50, 200 periods) to detect trends and momentum shifts.
Daily Open and Monday Range: Highlights key levels like daily open and intraday/multi-day high-low ranges for better price context.
Delta Volume Analysis: Measures the net difference between buying and selling volume for market sentiment insights.
Divergence Detection: Detects regular and hidden bullish/bearish divergences for trend reversal opportunities.
Visual Alerts: Displays intuitive symbols for potential buy/sell signals and key price levels.
Added Value: Why Is This Indicator Original/Why Shall You Pay for This Indicator?
The ZenAlgo - Heavy Delta indicator offers a distinct advantage by integrating multiple analysis techniques into one cohesive tool. While many individual indicators are freely available, this script goes beyond simple overlays to provide an advanced analytical framework. Here’s why it stands out:
1. Synergy of Indicators
Order Blocks: These are not static; the indicator dynamically calculates zones where institutional activity likely occurred, supported by volume-weighted metrics.
Delta Volume Analysis: Freely available delta volume tools typically show raw data, but this script filters noise, categorizes volume into meaningful up/down segments, and integrates it with other signals for context.
VWAP and Moving Averages: VWAP and customizable MAs are enhanced with divergence checks, color-coded trends, and market state classifications. This integration helps confirm trends and reversals with higher precision.
2. Volume-Based Insights
Traditional volume indicators often fail to show the "intent" behind price moves. This script combines delta volume and order block data to highlight areas of significant buying or selling pressure and their potential impacts on future price action.
3. Visual Simplicity with Advanced Logic
Unlike using several separate tools, which can clutter your chart, this indicator presents a streamlined interface. Every plotted element serves a clear purpose, minimizing distractions while maximizing actionable insights.
4. Customized for Active Traders
The indicator doesn’t just provide standard calculations. It includes proprietary adjustments like mitigation thresholds in order blocks, percentage-based signals for VWAP, and delta volume intensity levels that align better with active market conditions.
5. Why Pay for It?
Time and effort savings: Instead of setting up and calibrating multiple tools, this indicator combines them into a single efficient package.
Enhanced accuracy: Each sub-indicator validates the others, reducing false signals.
Unique features: For instance, the script automatically adjusts for multi-timeframe inconsistencies and uses gradient color fills to convey volume strength in order blocks—a feature absent in free indicators.
How It Works
The indicator combines individual sub-indicators into a logical framework where each part contributes to the overall analysis. Here’s how each feature operates:
1. Order Blocks
Identification: Uses specific price action patterns to locate zones of likely institutional interest (bullish or bearish blocks).
Dynamic Updates: The blocks adjust as new price data comes in, ensuring their relevance. Volume within these zones is weighted, helping assess their strength and potential price reactions.
Visual Enhancements: Blocks are color-coded and filled with gradients based on volume intensity, providing immediate visual cues about their importance.
2. VWAP (Volume Weighted Average Price)
Calculation: Anchored to user-selected periods (daily, weekly, etc.), VWAP is recalculated in real-time, showing the "fair" price based on traded volume.
Integration: Acts as a dynamic support/resistance line, particularly useful in intraday and swing trading. Labels provide percentage deviation for quick interpretation.
3. Moving Averages (MAs)
Customization: Supports various types (EMA, SMA, etc.) and lengths (13, 21, 50, 200). Traders can configure these to suit their strategies.
Market Status: By comparing the price to these MAs, the indicator classifies the market as Full Bull, Bullish, Neutral, Bearish, or Full Bear. This high-level summary helps traders quickly gauge market sentiment.
4. Delta Volume
Core Logic: Calculates the net difference between buying and selling pressure (volume) for each candle.
Visual Signals: Plots symbols when significant delta volume changes coincide with other indicator signals, like divergence or order block activity.
5. Daily Open and Monday Range
Purpose: Identifies key psychological levels like the daily open and the high/low range for the first trading day of the week.
Context: Highlights these levels with dynamic percentage changes, helping traders understand how price is behaving relative to them.
6. Divergence Detection
Logic: Tracks discrepancies between price movement and momentum (via Moving Averages, Delta Volume, and Order Blocks). These divergences often precede reversals.
Validation: Divergences are only flagged when other features, like delta volume shifts or order block interactions, confirm the setup.
By combining these tools in a meaningful way, ZenAlgo - Heavy Delta transforms raw data into actionable intelligence, giving traders a comprehensive view of market dynamics and a significant edge in decision-making.
Why Use Heikin Ashi for Heavy Delta?
The ZenAlgo - Heavy Delta indicator is optimized for Heikin Ashi (HA) candles, which smooth out market noise and make trends more visually apparent. Heikin Ashi works best for this strategy for several key reasons:
Why Heikin Ashi Works Best
Trend Clarity: Unlike traditional candlesticks, Heikin Ashi averages price data to create smoother transitions. This helps the indicator better identify sustained trends and reduces false signals caused by short-term price fluctuations.
Noise Reduction: HA candles filter out minor fluctuations and emphasize the overall market direction, making it easier to align the indicator’s signals (like Delta Volume and Order Blocks) with larger market movements.
Improved Visual Insights: Features like Order Blocks and Delta Volume align well with Heikin Ashi's smoothed representation, as it avoids the erratic movements that traditional candles sometimes display.
Better Support for Trend Strategies: Heikin Ashi candles naturally highlight key reversals and continuation patterns, which complement the analytical goals of this indicator.
Important Notes About Heikin Ashi:
Synthetic Nature of HA Candles: Heikin Ashi values are calculated differently than traditional candles. For example: a) The open is the average of the prior candle's open and close. b) The close is the average of the high, low, open, and close. This synthetic nature means that HA candles do not reflect actual market prices but rather smoothed averages, which can slightly lag real-time price movements.
Lagging Effect: Because HA candles use averaged data, they can lag behind actual price action. This is beneficial for identifying trends but less effective for precise entry/exit timing.
Inaccuracy in Low Volatility: In low-volume or low-volatility conditions, HA candles may distort actual price dynamics, leading to less reliable insights.
No Direct Alerts or Buy/Sell Signals : Issuing explicit buy or sell signals based on Heikin Ashi candles is not possible due to their averaged, synthetic nature. As such, the ZenAlgo - Heavy Delta indicator does not generate direct trading signals. Instead, the indicator is a decision-support tool that provides insights into trends, volume dynamics, and potential key levels, leaving trade execution to the trader's discretion.
Usage Examples
Trend Confirmation: Use the MA market status to identify if the market is in a Full Bull or Bear state.
Reversal Zones: Monitor order block zones for price rejection or absorption, signaling a potential reversal.
Breakout Trading: Trade breakouts when price surpasses VWAP or Monday Range highs/lows.
Delta Divergence: Look for positive/negative delta volume divergences during consolidations for breakout cues.
Mean Reversion: Use VWAP or MAs as dynamic support/resistance for mean reversion setups.
Intraday Scalping: Utilize daily open and intraday levels for short-term trades.
Swing Trading: Employ order blocks and multi-day ranges to frame swing trade setups.
Volume Climax: Identify volume spikes using Delta Volume to confirm trend continuation or reversal.
Momentum Trading: Combine divergence signals with Delta Volume for high-conviction entries.
Risk Management: Use defined order block boundaries to set stop losses and targets.
Settings
Order Blocks: Customize label visibility, label offsets, and block appearance.
VWAP: Adjust anchor period and toggle visibility.
Moving Averages: Configure length, type (EMA, SMA, etc.), and visibility of MAs (13, 21, 50, 200).
Delta Volume: Enable/disable delta symbols and labels, adjust sensitivity multipliers.
Daily Open/Monday Range: Toggle visibility and customize display preferences.
General Visuals: Adjust label offsets, color schemes, and transparency.
Important Notes
This indicator is a technical analysis tool and does not guarantee trading success.
Use it in conjunction with other indicators and fundamental analysis for a more comprehensive trading strategy.
Performance may vary in low-liquidity markets or during sudden news events.
Divergence signals might fail in strongly trending markets.
Trademania - PVSRA IndicatorTrademania - PVSRA Indicator
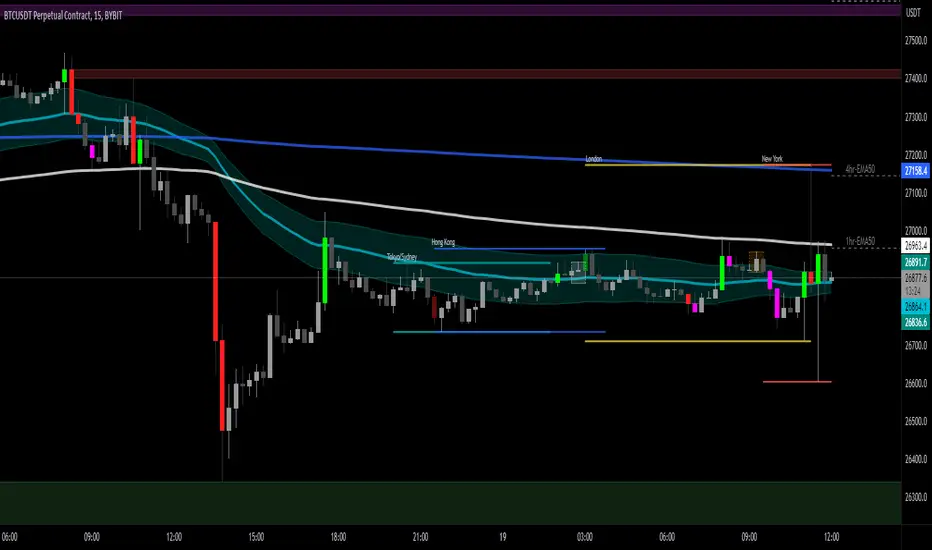
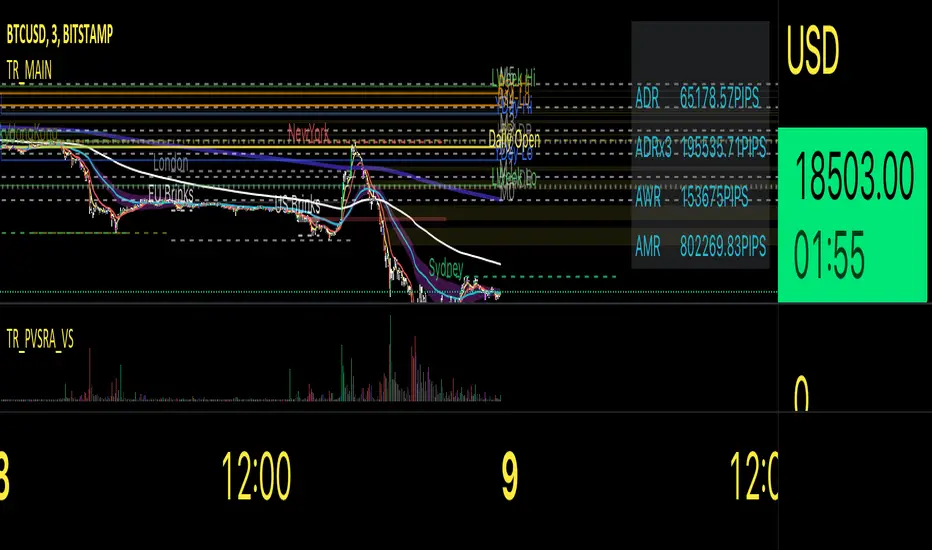
The Trademania - PVSRA Indicator is based on a proven MT4 indicator suite that has been in use since 2013. Over time, it has been expanded with additional features and tools. Originally developed for the Forex market, it also works well for cryptocurrencies, stocks, and other assets. The goal of this indicator is to combine classic chart analysis with PVSRA analysis, allowing for a clean mixed chart analysis. Traders gain access to a wide range of important information and can use it to form their trading assumptions. The indicator is designed to make it as simple as possible: identifying price levels at the breakout of key support/resistance, for confirmations above/below an imbalance, or recognizing and validating standard structures.
Important: This indicator is designed to be used across all timeframes. It works equally well for scalping on lower timeframes and for larger timeframes, such as spot trading on the 4H or daily chart.
The following core features are available:
- PVSRA Candles
- Dynamic Zones for PVSRA Candles (Imbalance)
- Market sessions with high/low points
- Integrated EMAs (daily, weekly, higher time frames)
- Fully customizable EMAs
- Pivot points with mid/50% level
- Price ranges from yesterday and last week
- Average daily range (also available for weekly and monthly)
- Psychological levels (for Forex)
- Daily open
- High/Low Point of Control (POC) indicators for wicks and candle bodies
- WIL (Weekly Interest Level) - High/Low of the Asian session
- On-chart labels for nearly all elements
Key Features:
- PVSRA, integrated POC levels, and WIL levels distinguish this indicator.
- Integrated EMAs and the daily, weekly, high time frame EMAs can be supplemented or replaced by custom EMAs for maximum flexibility.
Special Feature:
- Lite Mode for better visibility and simplified chart analysis.
Instructions and Notes
PVSRA Candles
Display volume or tick volume on the chart.
- Candles with more than 200% average volume of the last 10 candles, where the product of candle spread and volume is greater than the last 10 candles/timeframes, are shown in green (bullish) and red (bearish).
- Blue and purple candles show the same with 150% average volume of the last 10 candles.
**Note:** To obtain valid information, the trading volume should be as large as possible. If you're viewing the chart of an exchange with low trading volume, you can use the PVSRA override to display the volume from another exchange. For example, you can view the Phemex chart but display the tick/volume of the Binance chart as PVSRA/Vector candles.
Dynamic Zones for PVSRA Candles (Imbalance)
Zones that match the color of the respective vector candle display imbalance on the chart.
- In PVSRA analysis, it is assumed that such imbalances will be revisited and corrected. It can be customized whether this should happen with candle wicks or just the candle bodies.
Market Sessions with High/Low Points (DST)
Relevant market sessions: Sydney/NZX, Tokyo, Hong Kong, EU, New York, as well as the Brinks sessions pre EU/NY, are marked with high/low points and labeled on the chart.
- In PVSRA/Mixed analysis, these represent important liquidity zones of the individual trading sessions, often serving as key support/resistance levels.
WIL (Weekly Interest Level) - High/Low of the Asian Session
The new WIL levels represent the market open/Asian session of the new trading week: Sydney open to Hong Kong close.
- This forms an important price range for the trading week and is always a key breakout zone or rejection area in mixed analysis. Additional liquidity is needed to break through these levels.
- Higher effort against the start of the week – an imbalance (above/below).
High/Low Point of Control (POC) Indicators for Wicks and Candle Bodies
Additionally, the indicator includes pivot-based POC markers at key highs/lows on the chart.
- A POC is generated from the candle footprint (1000 resolution) and displayed on the chart.
- **Note:** If the POC is in a wick, it is shown as a line; if the POC is only in the candle body, it is displayed in small text.
- In mixed analysis, POCs in volume-heavy wicks are always a key indication of price levels that will be revisited and a potential enhancer for a wick-fill upwards or downwards.
EMA/Pivot Points/Psychological Levels Classic/Average Ranges:
Daily/ADR - Weekly/AWR / High/Low values for day/week, as well as the daily open of the current trading day, form the foundation of the indicator.
- Base structures that account for imbalance must break certain price levels to confirm or invalidate a previous movement (bullish or bearish).
- 13/50/200/800 EMA retrace: Breaking these in either direction without addressing an imbalance on the opposite side requires confirmation after the break.
- Pivot-level trading operates on the same principle.
- **Note:** Pivot levels in this indicator have additional M-levels, which represent 50% markers to provide better insights into potential retraces or upward moves.
- For example: Breaking M1, retracing, and confirming at M1 with a target at M2.
To recognize a standard 3-level rise or retrace scenario in mixed analysis, as well as a potential extended chart progression, these levels are essential.
**Note:** Average ranges such as High/Low ADR are particularly important levels where interruptions are expected. Profit-taking, long/short, is common at these points, independent of standard structures. This also applies to the high/low levels of the last trading day and the weekly versions of these levels.
The daily open helps identify possible SPOT/Futures gaps (depending on the asset, such as a missing futures market over the weekend: NAS/DAX).
Important:
The Lite Mode is designed to help traders reduce the chart to essential core functions (PVSRA/EMA/WIL/Psy/Daily Open/Hi-Lo) to apply classic TA effectively and strengthen a mixed analysis or challenge certain assumptions regarding confirmation and imbalance.
**Note:** It is recommended to additionally use a MACD indicator to identify potential trends and momentum.
- For example, a positive MACD trend supporting a 50 EMA breakout with a target of the 200 EMA under positive imbalance (standard mixed pattern).
To cater to personal preferences or trading strategies, it is possible to add custom EMA values to the indicator without the need for a second or third separate indicator.
All functions are fully customizable within the indicator settings.

Innocent Heikin Ashi Ethereum StrategyHello there, im back!
If you are familiar with my previous scripts, this one will seem like the future's nostalgia!
Functionality:
As you can see, all candles are randomly colored. This has no deeper meaning, it should remind you to switch to Heikin Ashi. The Strategy works on standard candle stick charts, but should be used with Heikin Ashi to see the actual results. (Regular OHLC calculations are included.)
Same as in my previous scripts we import our PVSRA Data from @TradersReality open source Indicator.
With this data and the help of moving averages, we have got an edge in the market.
Signal Logic:
When a "violently green" candle appears (high buy volume + tick speed) above the 50 EMA indicates a change in trend and sudden higher prices. Depending on OHLC of the candle itself and volume, Take Profit and Stop Loss is calculated. (The price margin is the only adjustable setting). Additionally, to make this script as simple and easily useable as possible, all other adjustable variables have been already set to the best suitable value and the chart was kept plain, except for the actual entries and exits.
Basic Settings and Adjustables:
Main Input 1: TP and SL combined price range. (Double, Triple R:R equally.)
Trade Inputs: All standard trade size and contract settings for testing available.
Special Settings:
Checkbox 1: Calculate Signal in Heikin Ashi chart, including regular candle OHLC („Open, High, Low, Close“)
Checkbox 2/3: Calculate by order fill or every tick.
Checkbox 4: Possible to fill orders on bar close.
Timeframe and practical usage:
Made for the 5 Minute to 1 hour timeframe.
Literally ONLY works on Ethereum and more or less on Bitcoin.
EVERY other asset has absolute 0% profitability.
Have fun and share with your friends!
Thanks for using!
Example Chart:

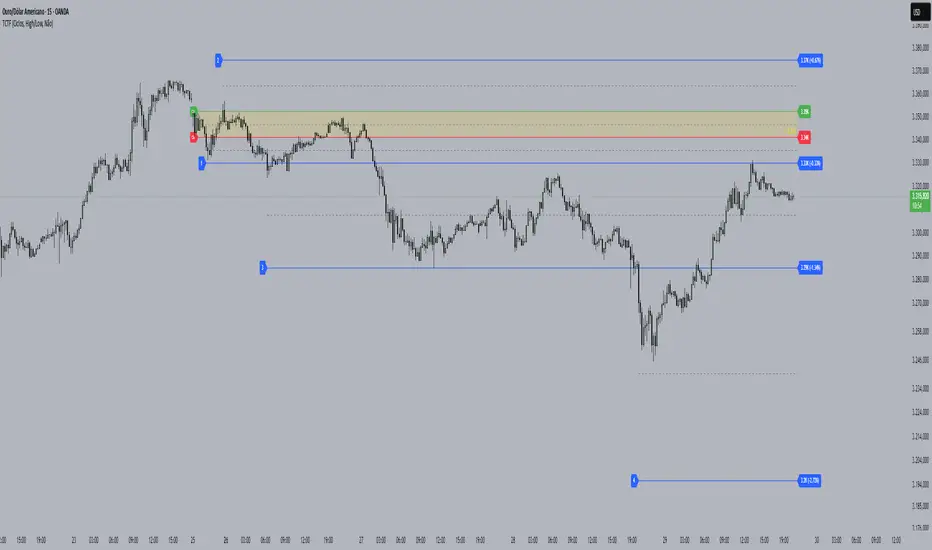
[DisDev] Tactical Analysis Part II: Levels🟩 Tactical Analysis Part II: Levels of the Battlefield represents the evolution of our comprehensive suite, expanding on the success of Tactical Analysis Part I: High-Volume Recovery . This advanced tool seamlessly integrates components from PVSRA, the Market Maker Method by Steve Mauro, and Tino from Traders Reality's Hybrid System, equipping traders with a significant advantage. With Tactical Analysis Part II, you gain access to a diverse range of essential features, including the DisDev Level Reducer™, designed to streamline your chart while ensuring you never overlook a critical level. Prepare to enhance your trading prowess with the power of Tactical Analysis Part II: Levels of the Battlefield.
⚡ OVERVIEW ⚡
Key Features 🔑
Daily Open: Marks the daily opening price at 00:00 UTC.
Weekly Open: Highlights the opening price at the start of each trading week.
Initial Balance (IB): Represents the high and low of the first hour of each day.
Pivot Points: Calculates the two closest pivot levels to the current price.
Volume Weighted Average Price (VWAPs): Marks key areas where the majority of transactions occur.
Average Daily Range (ADR) & Average Weekly Range (AWR): Indicates potential price movement boundaries.
Psychological Levels: A weekly range established each Saturday evening.
Benefits 💸
Comprehensive Analysis: Consolidates multiple important trading metrics into one indicator.
Time Efficiency: Saves time that would be spent manually tracking each of these metrics.
Enhanced Decision Making: Helps traders make more informed decisions by providing important levels.
⚙️ CONFIGURATION & SETTINGS ⚙️
Inputs 🔧
Level Reducer: Allows the user to declutter the chart while still tracking all selected levels.
Level and Label Settings: Provides control over the visibility and length of level lines and labels.
Customizable Settings: Enable or disable any level
Alerts 🔔
Tactical Coordinates Table: Updates levels dynamically in the table according to the actual price.
Real-time Alerts: The Indicator provides alerts when price approaches or crosses any of the defined levels.
Tactical Coordinates Table
Alerts
💡 USAGE & STRATEGY 💡
Trading Strategies 📈
Level Confirmation: Use the Indicator's defined levels as confirmations for your own trading strategies.
Reversal Spots: Levels like the daily and weekly opens or the VWAPs can be potential reversal points.
Breakout Trades: Initial Balance (IB) levels could provide breakout trade opportunities.
Timeframes and Symbols ⌚
Multi-Timeframe: Indicator is compatible with multiple timeframes.
Versatile: Can be used on any crypto trading pair on TradingView.
🤖 DETAILS & METHODOLOGY 🤖
Algorithm and Calculation 🛡️
Dynamic Calculation: Levels are calculated based on price and time data, providing real-time insights.
Pivot Points: Calculated based on a specific formula involving past and subsequent bars or candles.
VWAPs: Calculated based on the average price weighted by volume.
📚 ADDITIONAL RESOURCES 📚
Tutorials and Guides 📖
Visit our website to download comprehensive PDF documents that provide in-depth explanations on various key topics. These include:
Understanding various trading levels such as Daily Open, Weekly Open, Initial Balance (IB), Pivot Points, VWAPs, ADR & AWR, and Psychological Levels.
How data in different time frames is calculated and how this affects the marking of High and Low levels on different time frames.
How our script addresses the data limitations in TradingView, ensuring all levels are shown at the lowest time frame allowable.
Adjusting level and label settings in the indicator.
Using the Level Reducer function to help declutter your chart while still tracking all selected levels.
Chart Examples 📊
Daily Levels
Weekly and Monthly Levels
Tactical Coordinates Table
🚀 CONCLUSION 🚀
The Indicator, with its Levels feature, provides a unique perspective to day and swing traders. Its ability to dynamically calculate and visualize critical trading levels and ranges aims to empower traders with timely insights and efficient analysis. Whether you're an experienced trader or just starting out, integrating these level markers into your trading strategy can significantly improve your market understanding and decision-making process.
The complete Tactical Analysis Indicator Suite
⚠️ DISCLAIMER ⚠️
This indicator is provided as a tool for traders and is not intended to be the sole basis for any trading decision. Always conduct your own research and due diligence, and consider your risk tolerance before entering any trades. Trading involves risk and is not suitable for everyone.

[DisDev] Tactical Analysis Part I: High-Volume Recovery🟩 Tactical Analysis Part I: High-Volume Recovery . Introducing the Tactical Analysis Indicator Suite , a comprehensive three-indicator system designed to provide traders with insights into high-volume candles, Induction Recovery Zones™, market sessions, and more. This versatile tool combines elements from PVSRA, Market Maker Method by Steve Mauro, and Tino from Traders Reality's Hybrid System, to enhance your trading performance.
⚡ OVERVIEW ⚡
Key Features 🔑
Induction Candles
Induction Recovery Zones™
Session - High & Low
Tactical Windows
EMA’s
Induction Table
Benefits 💸
Gain a better understanding of market dynamics through high-volume candle analysis.
Identify potential areas of liquidity and price recovery with Induction Recovery Zones™.
Keep track of major market sessions and their impact on price action.
Enhance your trading strategies with additional insights from Tactical Windows and EMA analysis.
Monitor the performance of top cryptocurrencies at a glance with the Induction Table.
⚙️ CONFIGURATION & SETTINGS ⚙️
Inputs 🔧
Customize the settings for Induction Candles, Induction Recovery Zones™, Session lines, Tactical Windows, and the Induction Table.
Adjust the EMA periods to match your preferred trading style.
Alerts 🔔
Set up alerts for Induction Candles and Induction Recovery Zone events.
Configure alerts for session openings and Tactical Windows to stay informed of market activity.
💡 USAGE & STRATEGY 💡
Trading Strategies 📈
Incorporate high-volume candle analysis into your existing trading strategies to better understand market conditions.
Use Induction Recovery Zones™ to identify potential price reversal areas and plan entries or exits accordingly.
Monitor market sessions, Tactical Windows, and the 4hr - 50 EMA to make informed decisions about trade timing.
Timeframes and Symbols ⌚
Recommended for use on timeframes of 30 minutes or lower for accurate session line representation.
Designed for all cryptocurrency markets. Forex and other major markets are currently under development.
🤖 DETAILS & METHODOLOGY 🤖
Algorithm and Calculation 🛡️
The algorithm identifies Induction Candles based on two conditions, taking into consideration volume and candle range.
Induction Recovery Zones™ are calculated based on the Induction Candles and their potential for price recovery.
📚 ADDITONAL RESOURCES 📚
Tutorials and Guides 📖
Our website provides comprehensive tutorials and guides to help users get the most out of this three-indicator suite.
Chart Examples 📊
London Tactical Window impulse break of the high, reversal
Induction Table - Monitor up to 12 other symbol’s Induction activity
EMA Crosses, Tactical Window, Future Sessions, Static EMA’s, and Recovery Zones
TA Part 1 and Part 2 integration
🚀 CONCLUSION 🚀
The Tactical Analysis Pt 1 - High Volume Recovery indicator offers a comprehensive and powerful toolset for traders, combining high-volume candle analysis, Induction Recovery Zones™, market session tracking, Tactical Windows, and EMA analysis. This unique combination of features is designed to help you make more informed trading decisions and enhance your overall trading performance. We encourage you to try out this indicator suite and experience the benefits it can bring to your trading journey.
The complete Tactical Analysis Indicator Suite
⚠️ DISCLAIMER ⚠️
This indicator is provided as a tool for traders and should not be used as the sole basis for making trading decisions. Always conduct your own research and consider your risk tolerance before entering any trades.
Vector Candle Zones/Cloud MTF X4Description:
This indicator employs Price, Volume, Support, Resistance Analysis (PVSRA), a trading strategy that analyzes price movements, volume, support, and resistance levels to identify potential trading opportunities. It detects large, volatile moves with significant activity in specific zones on the chart, which the market tends to revisit due to the high transaction volume in these areas. The primary purpose of this indicator is to draw these high probability areas where the market is likely to return.
The PVSRA algorithm used in this indicator:
Detects climactic situations: The algorithm identifies climactic situations by looking at bars where the volume is at least 200% of the average volume of the previous 10 bars. Additionally, it checks if the product of the candle spread, and candle volume is greater than or equal to the highest value for the previous 10 bars. In these situations, if the bar is bullish (closing price is higher than the opening price), it is colored green; if it's bearish (closing price is lower than the opening price), it is colored red.
Detects above-average volume situations: The algorithm looks for bars with a volume that is at least 150% of the average volume of the previous 10 bars. In these cases, if the bar is bullish, it is colored blue; if it's bearish, it is colored violet.
If the bar does not fall into climactic and above-average situations: The bar is colored with shades of gray depending on whether it's bullish or bearish, and is not considered a vector (aka. vector zone of interest).
The algorithm calculations can adapt to show the above information also from higher time-frames.
Using the indicator:
Utilize this indicator to trade towards and away from vector areas, and watch for reversals when these zones are recovered. While there are no certainties in trading, only probabilities, the vector candles on the chart represent high probability areas the market often revisits. Additionally, zones recovered between 50% - 100% signal high probability points where the market might change direction. The likelihood of market direction change increases as more vectors are recovered in succession. Although there is no set rule for when these vectors are recovered, monitoring candle colors (green, blue, red, purple) can help gauge the speed of a move to and from a zone. To use this indicator more effectively, establish a trend using other preferred indicators or even a simple EMA. Spend time studying how these zones are recovered for each specific asset.
Main Features:
High volume candles are detected and marked with colors, indicating high probability areas the market may revisit.
The indicator shows the percentage of a zone's recovery with labels for clear visibility.
If ghosting is enabled, fully recovered past candles (also called vectors) are highlighted to signal potential reversal points.
Imbalance Weighted Average (IWA) can be activated to display the point of attraction (mid/high/low) on high interest zones.
Fair Value Gaps can be displayed alongside PVSRA candles, as both represent imbalances in the chart.
The indicator supports showing 3x-4x higher timeframe PVSRA zones on a lower timeframe for convenience.

Traders Reality Vector Candle ZonesVector Candle Zone indicator displays areas of unrecovered liquidity based on PVSRA with override option for the chart symbol.
Developed for TradersReality by infernixx with library conversion by peshocore

Traders Reality PVSRA Volume SuitePVSRA volume bars color coded to PVSRA vector candles and with override option and configurable moving average.
Indicator displays volume bars color coded to PVRSA price action and allows the user to override the chart symbol.
Developed for TradersReality by infernixx with library conversion by peshocore.
Traders Reality MainThis indicator serves as the Tradingview equivalent of an MT4 indicator suite.
It differentiates from existing TV indicators in its style and total feature set (most notably PVSRA and PVSRA Override)
It was originally designed for forex markets, and it will work for crypto as well, but it has not been tested on stocks.
List of features:
PVSRA Candles
Market boxes (NY/JP/ HK /UK/ FR and Brinks Boxes)
5/13/50/200/800 EMAs (cloud for 50EMA)
Pivot points (S/M/R 1,2,3; PP )
Yesterday and Last Week price range
Average Daily Range (Weekly and Monthly as well)
Daily Open
PVSRA Override
Psychological High/Low
Vector Candle Zones
All of these are configurable in the indicator settings.
Usage instructions:
PVSRA Candle colors meaning:
Green (bull) and red (bear): Candles with volume >= 200% of the average volume of the 10 previous chart candles, and candles where the product of candle spread x candle volume is >= the highest for the 10 previous chart time candles.
Blue (bull) and blue-violet (bear): Candles with volume >= 150% of the average volume of the 10 previous chart candles
PVSRA Override
In order to get reliable bar coloring, we need accurate data. If you're on a chart with low volume on some obscure exchange, you may want to use another exchanges datafeed for the symbol you are on to calculate the PVSRA bar colors with. This lets you do exactly that. By default it's off, but you can turn it on and use INDEX:BTCUSD, or really any other chart you want. You can combine charts too, e.g. use BINANCE:BTCUSDT+COINBASE:BTCUSD.
PVSRA Alerts
Alerts can be made for PVSRA "vector"/"climax" candles:
1. Create Alert (Clock with + sign)
2. Set Condition: "Traders Reality",
3. Select "Alert on Vector Candle",
4. Set it to Once per Bar,
5. choose your notification options.
Market boxes
The market boxes times are configurable and will change depending on the exchange timezone. I recommend to pick your main exchange/chart and adjust the times so that they are correct. Technically you will need to shift the time from the exchanges' timezone to GMT . Default values should be good for UTC based exchanges in current US+UK summer time.
Psychological High/Low
Configurable for Crypto or Forex - draws the perceived Psychological High/Low ranges for the week. Can display historical values too.
Vector Candle Zones
displays unrecovered liquidity left behind on unrecovered vectors. Configurable to take into account candle bodies or candles and wicks.
Recommended additional Tradingview indicator(s):
- TDI - Goldminds, Edited for Market Makers Method by Jakub Donovan
Footnotes
The code was originally by plasmapug, continued development (with permission) is now done by infernix and peshocore and xtech5192 in collaboration with TradersReality.
If you have suggestions or questions, you can message me or leave a comment.
Traders_Reality_LibLibrary "Traders_Reality_Lib"
This library contains common elements used in Traders Reality scripts
calcPvsra(pvsraVolume, pvsraHigh, pvsraLow, pvsraClose, pvsraOpen, redVectorColor, greenVectorColor, violetVectorColor, blueVectorColor, darkGreyCandleColor, lightGrayCandleColor)
calculate the pvsra candle color and return the color as well as an alert if a vector candle has apperared.
Situation "Climax"
Bars with volume >= 200% of the average volume of the 10 previous chart TFs, or bars
where the product of candle spread x candle volume is >= the highest for the 10 previous
chart time TFs.
Default Colors: Bull bars are green and bear bars are red.
Situation "Volume Rising Above Average"
Bars with volume >= 150% of the average volume of the 10 previous chart TFs.
Default Colors: Bull bars are blue and bear are violet.
Parameters:
pvsraVolume : the instrument volume series (obtained from request.sequrity)
pvsraHigh : the instrument high series (obtained from request.sequrity)
pvsraLow : the instrument low series (obtained from request.sequrity)
pvsraClose : the instrument close series (obtained from request.sequrity)
pvsraOpen : the instrument open series (obtained from request.sequrity)
redVectorColor : red vector candle color
greenVectorColor : green vector candle color
violetVectorColor : violet/pink vector candle color
blueVectorColor : blue vector candle color
darkGreyCandleColor : regular volume candle down candle color - not a vector
lightGrayCandleColor : regular volume candle up candle color - not a vector
@return
adr(length, barsBack)
Parameters:
length : how many elements of the series to calculate on
barsBack : starting possition for the length calculation - current bar or some other value eg last bar
@return adr the adr for the specified lenght
adrHigh(adr, fromDo)
Calculate the ADR high given an ADR
Parameters:
adr : the adr
fromDo : boolean flag, if false calculate traditional adr from high low of today, if true calcualte from exchange midnight
@return adrHigh the position of the adr high in price
adrLow(adr, fromDo)
Parameters:
adr : the adr
fromDo : boolean flag, if false calculate traditional adr from high low of today, if true calcualte from exchange midnight
@return adrLow the position of the adr low in price
splitSessionString(sessXTime)
given a session in the format 0000-0100:23456 split out the hours and minutes
Parameters:
sessXTime : the session time string usually in the format 0000-0100:23456
@return
calcSessionStartEnd(sessXTime, gmt)
calculate the start and end timestamps of the session
Parameters:
sessXTime : the session time string usually in the format 0000-0100:23456
gmt : the gmt offset string usually in the format GMT+1 or GMT+2 etc
@return
drawOpenRange(sessXTime, sessXcol, showOrX, gmt)
draw open range for a session
Parameters:
sessXTime : session string in the format 0000-0100:23456
sessXcol : the color to be used for the opening range box shading
showOrX : boolean flag to toggle displaying the opening range
gmt : the gmt offset string usually in the format GMT+1 or GMT+2 etc
@return void
drawSessionHiLo(sessXTime, show_rectangleX, show_labelX, sessXcolLabel, sessXLabel, gmt, sessionLineStyle)
Parameters:
sessXTime : session string in the format 0000-0100:23456
show_rectangleX : show the session high and low lines
show_labelX : show the session label
sessXcolLabel : the color to be used for the hi/low lines and label
sessXLabel : the session label text
gmt : the gmt offset string usually in the format GMT+1 or GMT+2 etc
sessionLineStyle : the line stile for the session high low lines
@return void
calcDst()
calculate market session dst on/off flags
@return indicating if DST is on or off for a particular region
timestampPreviousDayOfWeek(previousDayOfWeek, hourOfDay, gmtOffset, oneWeekMillis)
Timestamp any of the 6 previous days in the week (such as last Wednesday at 21 hours GMT)
Parameters:
previousDayOfWeek : Monday or Satruday
hourOfDay : the hour of the day when psy calc is to start
gmtOffset : the gmt offset string usually in the format GMT+1 or GMT+2 etc
oneWeekMillis : the amount if time for a week in milliseconds
@return the timestamp of the psy level calculation start time
getdayOpen()
get the daily open - basically exchange midnight
@return the daily open value which is float price
newBar(res)
new_bar: check if we're on a new bar within the session in a given resolution
Parameters:
res : the desired resolution
@return true/false is a new bar for the session has started
toPips(val)
to_pips Convert value to pips
Parameters:
val : the value to convert to pips
@return the value in pips
rLabel(ry, rtext, rstyle, rcolor, valid, labelXOffset)
a function that draws a right aligned lable for a series during the current bar
Parameters:
ry : series float the y coordinate of the lable
rtext : the text of the label
rstyle : the style for the lable
rcolor : the color for the label
valid : a boolean flag that allows for turning on or off a lable
labelXOffset : how much to offset the label from the current position
rLabelOffset(ry, rtext, rstyle, rcolor, valid, labelXOffset)
a function that draws a right aligned lable for a series during the current bar
Parameters:
ry : series float the y coordinate of the lable
rtext : the text of the label
rstyle : the style for the lable
rcolor : the color for the label
valid : a boolean flag that allows for turning on or off a lable
labelXOffset : how much to offset the label from the current position
rLabelLastBar(ry, rtext, rstyle, rcolor, valid, labelXOffset)
a function that draws a right aligned lable for a series only on the last bar
Parameters:
ry : series float the y coordinate of the lable
rtext : the text of the label
rstyle : the style for the lable
rcolor : the color for the label
valid : a boolean flag that allows for turning on or off a lable
labelXOffset : how much to offset the label from the current position
drawLine(xSeries, res, tag, xColor, xStyle, xWidth, xExtend, isLabelValid, labelXOffset, validTimeFrame)
a function that draws a line and a label for a series
Parameters:
xSeries : series float the y coordinate of the line/label
res : the desired resolution controlling when a new line will start
tag : the text for the lable
xColor : the color for the label
xStyle : the style for the line
xWidth : the width of the line
xExtend : extend the line
isLabelValid : a boolean flag that allows for turning on or off a label
labelXOffset : how much to offset the label from the current position
validTimeFrame : a boolean flag that allows for turning on or off a line drawn
drawLineDO(xSeries, res, tag, xColor, xStyle, xWidth, xExtend, isLabelValid, labelXOffset, validTimeFrame)
a function that draws a line and a label for the daily open series
Parameters:
xSeries : series float the y coordinate of the line/label
res : the desired resolution controlling when a new line will start
tag : the text for the lable
xColor : the color for the label
xStyle : the style for the line
xWidth : the width of the line
xExtend : extend the line
isLabelValid : a boolean flag that allows for turning on or off a label
labelXOffset : how much to offset the label from the current position
validTimeFrame : a boolean flag that allows for turning on or off a line drawn
drawPivot(pivotLevel, res, tag, pivotColor, pivotLabelColor, pivotStyle, pivotWidth, pivotExtend, isLabelValid, validTimeFrame, levelStart, pivotLabelXOffset)
draw a pivot line - the line starts one day into the past
Parameters:
pivotLevel : series of the pivot point
res : the desired resolution
tag : the text to appear
pivotColor : the color of the line
pivotLabelColor : the color of the label
pivotStyle : the line style
pivotWidth : the line width
pivotExtend : extend the line
isLabelValid : boolean param allows to turn label on and off
validTimeFrame : only draw the line and label at a valid timeframe
levelStart : basically when to start drawing the levels
pivotLabelXOffset : how much to offset the label from its current postion
@return the pivot line series
getPvsraFlagByColor(pvsraColor, redVectorColor, greenVectorColor, violetVectorColor, blueVectorColor, lightGrayCandleColor)
convert the pvsra color to an internal code
Parameters:
pvsraColor : the calculated pvsra color
redVectorColor : the user defined red vector color
greenVectorColor : the user defined green vector color
violetVectorColor : the user defined violet vector color
blueVectorColor : the user defined blue vector color
lightGrayCandleColor : the user defined regular up candle color
@return pvsra internal code
updateZones(pvsra, direction, boxArr, maxlevels, pvsraHigh, pvsraLow, pvsraOpen, pvsraClose, transperancy, zoneupdatetype, zonecolor, zonetype, borderwidth, coloroverride, redVectorColor, greenVectorColor, violetVectorColor, blueVectorColor, lightGrayCandleColor)
a function that draws the unrecovered vector candle zones
Parameters:
pvsra : internal code
direction : above or below the current pa
boxArr : the array containing the boxes that need to be updated
maxlevels : the maximum number of boxes to draw
pvsraHigh : the pvsra high value series
pvsraLow : the pvsra low value series
pvsraOpen : the pvsra open value series
pvsraClose : the pvsra close value series
transperancy : the transparencfy of the vecor candle zones
zoneupdatetype : the zone update type
zonecolor : the zone color if overriden
zonetype : the zone type
borderwidth : the width of the border
coloroverride : if the color overriden
redVectorColor : the user defined red vector color
greenVectorColor : the user defined green vector color
violetVectorColor : the user defined violet vector color
blueVectorColor : the user defined blue vector color
lightGrayCandleColor : the user defined regular up candle color
cleanarr(arr)
clean an array from na values
Parameters:
arr : the array to clean
@return if the array was cleaned
calcPsyLevels(oneWeekMillis, showPsylevels, psyType, sydDST)
calculate the psy levels
4 hour res based on how mt4 does it
mt4 code
int Li_4 = iBarShift(NULL, PERIOD_H4, iTime(NULL, PERIOD_W1, Li_0)) - 2 - Offset;
ObjectCreate("PsychHi", OBJ_TREND, 0, Time , iHigh(NULL, PERIOD_H4, iHighest(NULL, PERIOD_H4, MODE_HIGH, 2, Li_4)), iTime(NULL, PERIOD_W1, 0), iHigh(NULL, PERIOD_H4,
iHighest(NULL, PERIOD_H4, MODE_HIGH, 2, Li_4)));
so basically because the session is 8 hours and we are looking at a 4 hour resolution we only need to take the highest high an lowest low of 2 bars
we use the gmt offset to adjust the 0000-0800 session to Sydney open which is at 2100 during dst and at 2200 otherwize. (dst - spring foward, fall back)
keep in mind sydney is in the souther hemisphere so dst is oposite of when london and new york go into dst
Parameters:
oneWeekMillis : a constant value
showPsylevels : should psy levels be calculated
psyType : the type of Psylevels - crypto or forex
sydDST : is Sydney in DST
@return

Unrecovered Imbalanced Zone with PVRSAThis indicator highlights imbalanced PVSRA candles that have not been recovered.
Bullish Candles/Zones
200% Volume = Green
150% Volume = Blue
Bearish Candles/Zones
200% Volume = Red
150% Volume = Fuchsia
Imbalanced Zones with normal/below 150% Average 10ema volume can be displayed or hidden from view (Hidden by default)

B&S v3.4This is the new version of the indicator for the "B&S" strategy.
VERSION: B&S v3.4
We will explain how using our trading strategy developed by one of our programs and traders at DCA works.
HOW IT WORKS:
The "B&S" strategy uses RMA which is the same moving average used by the RSI, as they cross they give us an entry signal, be it a buy or sell, as the entry signal the script will color as bars according to the signal.
When an ORANGE candle appears, it indicates a large buy volume and when a PURPLE candle appears it indicates a lot of sales volume.
T⇡ or T⇣ indicates a long-term trend reversal.
DASHBOARD:
Our dashboard indicates the volatility of the traded asset, the short-term trend and the trade signal.
HOW TO USE:
If the trader is trading any asset in UP trend it is good to avoid SELL signals, but not mandatory, because if this SELL signal is accompanied by a STRONG SELL with purple candles then it indicates that the market makers (MARKET MAKERS) are "pushing" the price a little higher for the net positions of Retail Traders or other MM. This applies to downtrend.
Configure according to your trading strategy.
Financial markets are uncertain and information with the country's policy, so it is always good before any entry to analyze the market to understand what is happening with the traded asset.

PVSRA StudyThis script will show you the percentage change in volume and also consider stopping volume that is genuine reversal volume.
PVA Volume - DataCrypto Analytics
The PVA Volume indicator (Price Volume Analysis) is a technical indicator that transforms the accumulated historical data.
The PVA Volume Indicator displays a color-coded volume histogram based on Price Volume Analysis (PVA). It is plotted on a separate panel below the price chart of the underlying asset and colors the candles according to the PVA. The indicator represents four market states by means of four different colored histogram bars:
Green : Extreme volume on a bullish candle
Red : Extreme volume on a bearish candle
Silver : Neutral Volume, increasing more than the average
Gray : Neutral Volume
The PVA Volume indicator can be applied to confirm the action of the high or low price of any financial instrument.
Market Maker BalanceWhere is the market maker in his cycle of building longs or shorts? When is that big drop or big pump coming?
This is a simple and unexpectedly powerful indicator that shows you an estimate of the market maker's position over the last 200 candles. It works on any timeframe.
How does it work?
It combines a simple 10-candle Price Volume Support Resistance Analysis metric of climactic and rising volume. That volume is combined to create a bullish and bearish balance over a period of 200 candles. The curves are smoothed out with a 10 period EMA.
The MMB (Marker Maker Balance) oscillator is the resulting bearish volume - bullish volume, which shows us THEIR position balance.
Indications:
when shorts are increasing (further below 0), we are in a bullish trend -- you should be taking profit on longs
when shorts are flat or decreasing, the trend is due for a reversal -- you should be closing longs and looking to short
when shorts cross 0 to long, the trend is reversing down -- you should be in a short position by now
when longs are increasing, we are in a bearish trend -- you should be taking profits on your shorts
when longs are flat or decreasing, the trend is due for a reversal -- you should be closing your shorts
For extra information, there are also the separate lines for rising and climactic volume to give you early indications of reversal or change in Market Maker behaviour. You can disable them in the Style settings, but they can be a useful early indicator that the current trend is losing strength when rising volume overtakes climax volume (MM's no longer moving out of zones higher/lower).
Ways to use this indicator are quite simple and eerily accurate:
for short term gains, do the opposite of MMs: long when MM are opening more shorts, short when they are opening more longs
for huge positions, mimic the MM position: build long positions / close shorts when MMB is rising, build shorts / close longs when MMB is falling or crosses above 0 (be careful with leverage, begin on 1x leverage)
Note: the results of this indicator will be different for each exchange, because of their different trading volumes per candle. It's advisable to use it for the exchange you're trading on or use a chart that averages all exchanges for that asset, like INDEX:BTCUSD.
For those of you who use the Backtesting & Trading Engine by PineCoders, the BTE Signal plot generates long and short entries as well as filter states. Use this plot as the source for BTE.
Shout out to @infernixx for PVSRA calculations in his awesome Traders Reality indicator, the code of which I shamelessly ripped off and edited for this indicator.
Leave comments below if you want something added.
Market Makers (PVSRA) - DataCrypto Analytics
Script to track market makers.
Colors candles with higher trading volumes, demonstrating that a lot of smart money is happening.
Exponential moving averages of 100, 200 and 233 periods with VWMAP 25 and DRAGON.
To use this indicator, it is necessary to understand PVSRA strategy.
You can read our PVSRA study on our profile.
//////////////////////////////////////////////////////////////////////////////////////////////////////
// PORTUGUES
//////////////////////////////////////////////////////////////////////////////////////////////////////
Script para rastrear Formadores de Mercado.
Colore velas com volumes de negociação mais altos, demonstrando que muito dinheiro inteligente está acontecendo.
Médias móveis exponenciais de 100, 200 e 233 períodos com VWMAP 25 e DRAGON.
Para usar este indicador, é necessário entender a estratégia PVSRA.
Você pode ler sobre estudo PVSRA em nosso perfil.

PVA Volume + ATRThis indicator is actually a counterpart of the @JAPARICO indicator, if you can use the separate ATR use his, I also ask you to enjoy his indicator in the link below.
I created the PVA Candle + Dragon, in which he repatriated the indicator, I am doing the same, repatriating the indicator he created by adding the Average True Range (ATR), within the same indicator so that it can save space, many people end up leaving use for not having the necessary limit, so I decided to merge the same PVA Volume indicator so that you can use the Japa Rico strategy in a simple and easy way without being able to keep changing the indicator, the settings are easy, you will open the indicator gear in the settings -> clicking on style and changing the precision to 4 in order to apply the ATR to FOREX strategy. So the numeral ATR will be available in red, for you to use in your operations.
The code will be blocked, only @JAPARICO is the official owner of that indicator.

Whole Half Quarter Levels© ForexPipCheats and iceicebaby_
This indicator is coded to run on Trading View which was originally created by traderathome (TAH), qFish, and all other respective contributors for the mt4 version.
This indicator helps to enhance the visuals of the current price at the whole, half and quarter levels.
From time to time when there is a surge in price, the indicator might produce diagonal lines. If that occurs, simply switch TF and it should disappear. Otherwise, refresh or restart the indicator.
