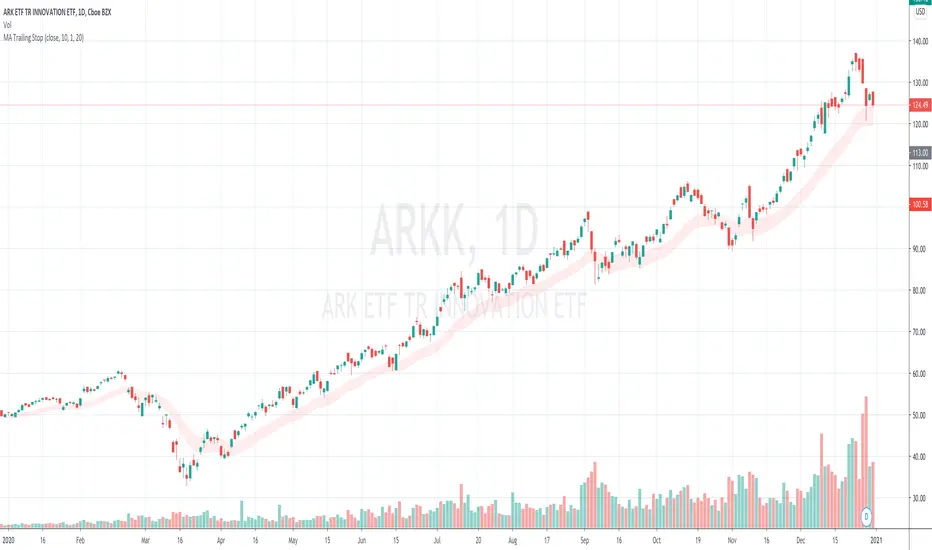
MA Trailing StopA Trailing Stop indicator that uses a multiple of ATR below a SMA/EMA line. Support long positions only.
Configurables:
1. Use SMA or EMA
2. MA Period
3. ATR multiplier
4. ATR look back period
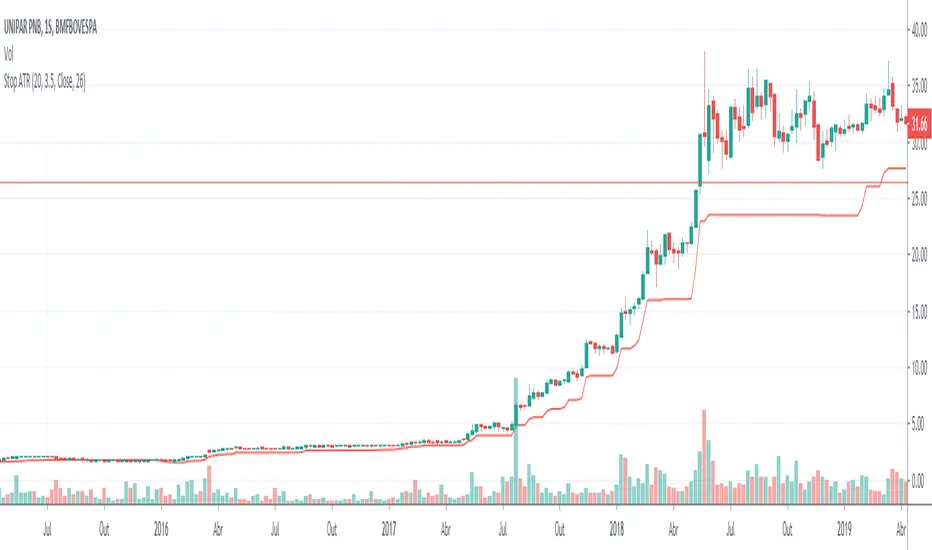
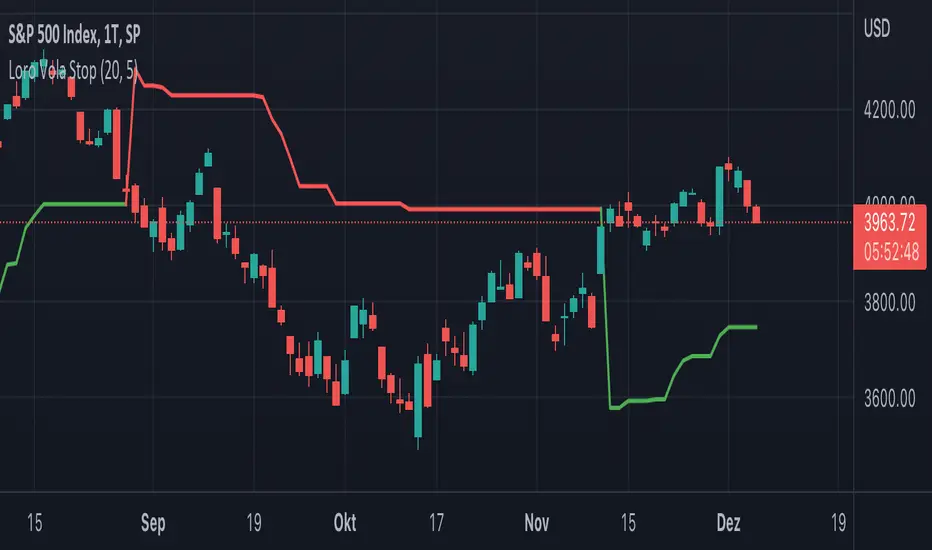
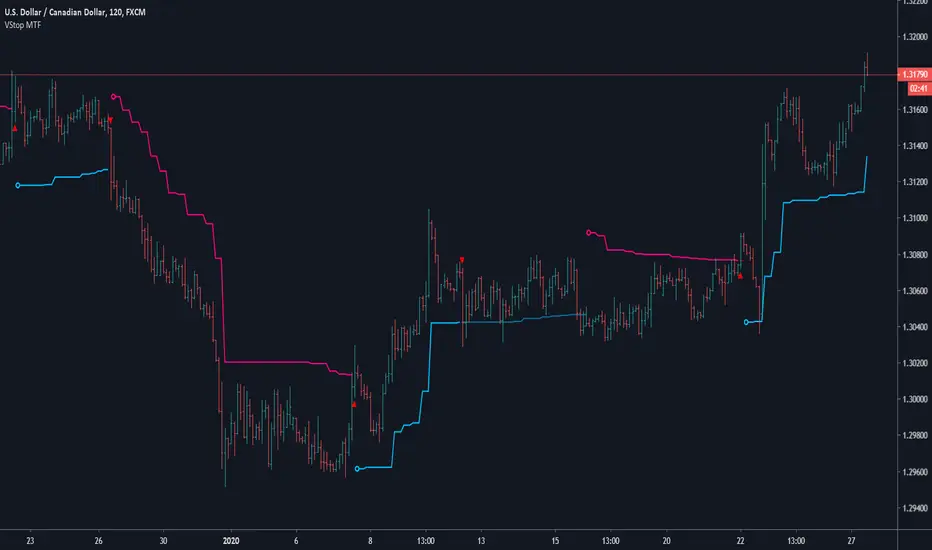
The bottom of the red area indicates the stop line. The top of the red area indicates the reference MA line.
Ideal use case is you find your a red area that covers most local lows.
The stop line moves up with MA, but does not move down if MA moves down.
If moves down (re-calculates itself) only when a low penetrates the stop line.
Pine Script® indicator