Monthly Crypto Analysis: Cardano (ADA/USD) – Issue 104 The analyst expects Cardano’s price to rise by the specified end time, based on quantitative analysis.
The take-profit level only highlights the potential price range during this period — it’s optional and not a prediction that the market will necessarily reach it.
You don’t need to go all-in or use leverage to trade wisely.
Allocating just a portion of your funds helps keep overall risk low and ensures a more sustainable approach.
Our strategy is built on institutional portfolio management principles, not the high-risk, all-in trading styles often promoted on social media.
Results are evaluated over the entire analysis period, regardless of whether the take-profit level is reached.
The validity of this analysis is based on a specific time range (until 07 Dec 2025), and after this period, the analysis will be reviewed and updated (once every 28 days).
Trade ideas

ADA - Hourly TimeframeAn hourly timeframe view of ADA moving through the month and year.
T.A explained -
BackSide (BS)
FrontSide (FS)
Inverse BS (Inv.BS)
Inverse FS (Inv.FS)
BS & FS levels are expected support when dashed lines, tested when dotted and resistance when solid lines.
The inverse is true for the Inv. BS Inv. FS levels, they are resistance as dashed lines, tested as dotted and support as solid lines.
Monthly timeframe is color pink
weekly grey
daily is red
4hr is orange
1hr is yellow
15min is blue
5min is green if they are shown.
strength favors the higher timeframe.
2x dotted levels are origin levels where trends have or will originate. When trends break, price will target the origin of the trend. its math, when the trend breaks, the vertex breaks too so the higher timeframe level/trend that breaks, the more volatility there could be as strength in the orders flow in to fuel the move.

ADAUSD capped at 5,997 resistanceThe ADAUSD remains in a neutral trend, with recent price action showing signs of an oversold rally within the broader range trading.
Support Zone: 5,237 – a key level from previous consolidation. Price is currently testing or approaching this level.
A bullish rebound from 5,237 would confirm ongoing upside momentum, with potential targets at:
5,997 – initial resistance
6,285 – psychological and structural level
6,571 – extended resistance on the longer-term chart
Bearish Scenario:
A confirmed break and daily close below 5,237 would weaken the bullish outlook and suggest deeper downside risk toward:
4,950 – minor support
4,613 – stronger support and potential demand zone
Outlook:
Bullish bias remains intact while the ADAUSD holds above 5,997 A sustained break below this level could shift momentum to the downside in the short term.
This communication is for informational purposes only and should not be viewed as any form of recommendation as to a particular course of action or as investment advice. It is not intended as an offer or solicitation for the purchase or sale of any financial instrument or as an official confirmation of any transaction. Opinions, estimates and assumptions expressed herein are made as of the date of this communication and are subject to change without notice. This communication has been prepared based upon information, including market prices, data and other information, believed to be reliable; however, Trade Nation does not warrant its completeness or accuracy. All market prices and market data contained in or attached to this communication are indicative and subject to change without notice.

How to Apply Quarter’s Theory on Cardano (ADA) | Crypto TAHow to Apply Quarter’s Theory on Cardano (ADA) | Crypto Technical Analysis
In this video, we break down how to draw and use Quarter’s Theory on Cardano (ADA) to understand market structure and price rotation in crypto.
You’ll learn how institutional traders use quarter levels to identify key turning points and why this method can help you see precision entries long before retail traders react.
Whether you’re trading spot or futures, this breakdown gives you a practical framework to read crypto price movement like a professional.
What You’ll Learn:
How to draw Quarter’s Theory levels on a crypto chart
Why market makers respect these levels across all timeframes
How to use quarter zones for entries, exits, and managing bias
Real example using ADA/USD
If you’re ready to stop guessing and start reading the market’s geometry, this is where to begin.
Tags: quarters theory, cardano analysis, crypto trading strategy, institutional trading concepts, market structure crypto

ADAUSD resistance retest at 5,997 The ADAUSD remains in a neutral trend, with recent price action showing signs of an oversold rally within the broader range trading.
Support Zone: 5,237 – a key level from previous consolidation. Price is currently testing or approaching this level.
A bullish rebound from 5,237 would confirm ongoing upside momentum, with potential targets at:
5,997 – initial resistance
6,285 – psychological and structural level
6,571 – extended resistance on the longer-term chart
Bearish Scenario:
A confirmed break and daily close below 5,237 would weaken the bullish outlook and suggest deeper downside risk toward:
4,950 – minor support
4,613 – stronger support and potential demand zone
Outlook:
Bullish bias remains intact while the ADAUSD holds above 5,997 A sustained break below this level could shift momentum to the downside in the short term.
This communication is for informational purposes only and should not be viewed as any form of recommendation as to a particular course of action or as investment advice. It is not intended as an offer or solicitation for the purchase or sale of any financial instrument or as an official confirmation of any transaction. Opinions, estimates and assumptions expressed herein are made as of the date of this communication and are subject to change without notice. This communication has been prepared based upon information, including market prices, data and other information, believed to be reliable; however, Trade Nation does not warrant its completeness or accuracy. All market prices and market data contained in or attached to this communication are indicative and subject to change without notice.

$ADA holding supportCRYPTOCAP:ADA continues to battle around the multi year support (green line)
The US Govt appears to be setting the conditions for opening and resuming their DUTY (crazy mfers)
The US govt shutdown has IMO been the catalyst for this decline as when there is no Govt people get worried, hmmm I wonder why that is.
If you did not capitulate and are still here congrats, you faced your fear and displayed courage and resilience, which are the enemy of the manipulators.
My analysis still holds, its beat up and has dipped below the parabolic curve (now dimmed on the chart) which is not ideal however given the manipulation and US Gov Shutdown alongside the exchanges dumping and manipulating the market. On the positive side of things CRYPTOCAP:ADA has retested the long term support and up to now has shown a nice retest. ADA price action continues to flip under and above .57 which indicates life and if things stay above .57 and slowly trickles back to the .80 .90 CRYPTOCAP:ADA could see a rally to ATH.
The market continues to wait and it looks as if the 4 yr cycle is no longer a good handrail to make assessments, more specifically the 4 yr cycle will continue to exist however the bull/bear nature seems now, to be tied more to world events than the halving itself.
stay positive
eat crayons
dont be greedy
GL

It might let us down once again !!!Cardano’s price on the 1-hour timeframe is forming an ascending triangle pattern.
If this pattern breaks to the upside, there’s hope that the AB leg will equal the CD leg, potentially pushing the price up to around $0.60.
However, since crypto often disappoints expectations, it might let us down once again—so stay cautious.

$ADA gaining supportCRYPTOCAP:ADA like the broader crypto market has been correcting.
ADA Has retested the .236 fib level and if it holds we could be seeing the beginning of a support base in order for ADA to make a significant move to the upside.
using the previous move to 1.3 I am watching the $2.3 level as a target for an impulsive move from here if ADA can flip the .53 price level as support.
this is where the committed are revealed in the crowd of get rich quick traders.

ADA at the Brink Breakdown or Breakout?The price has already dropped, and now it's time to buy targeting the $0.70 range.
Buy ADA/USD after we sweep $0.51I’ll only be looking for long setups after we sweep the equal lows around $0.51. Once the liquidity is taken, I expect price to tap into an imbalance or potentially push deeper into the extreme zone to mitigate the bullish order block.

ADAUSD important support at 5,240
The ADAUSD remains in a neutral trend, with recent price action indicating a corrective pullback within the broader trading range.
Support Zone: 5,240 – a key level from previous consolidation. Price is currently testing or approaching this level.
A bullish rebound from 5,240 would confirm ongoing upside momentum, with potential targets at:
6,000 – initial resistance
6,285 – psychological and structural level
6,570 – extended resistance on the longer-term chart
Bearish Scenario:
A confirmed break and daily close below 5,240 would weaken the bullish outlook and suggest deeper downside risk toward:
4,950 – minor support
4,610 – stronger support and potential demand zone
Outlook:
Neutral bias remains intact while the ADAUSD holds above 5,240 A sustained break below this level could shift momentum to the downside in the short term.
This communication is for informational purposes only and should not be viewed as any form of recommendation as to a particular course of action or as investment advice. It is not intended as an offer or solicitation for the purchase or sale of any financial instrument or as an official confirmation of any transaction. Opinions, estimates and assumptions expressed herein are made as of the date of this communication and are subject to change without notice. This communication has been prepared based upon information, including market prices, data and other information, believed to be reliable; however, Trade Nation does not warrant its completeness or accuracy. All market prices and market data contained in or attached to this communication are indicative and subject to change without notice.

$ADA On track but scraping the bottomCRYPTOCAP:ADA has had a tough October, and November is not starting well.
This is where you decide if you are a long term holder or you are going to tack your trading strat.
CRYPTOCAP:ADA needs to hold over the lower green line ( multi year ascending support ) in order to maintain the current structure.
will return with a longform assessment when there is something other than sideways movement.
patience is required.
GL
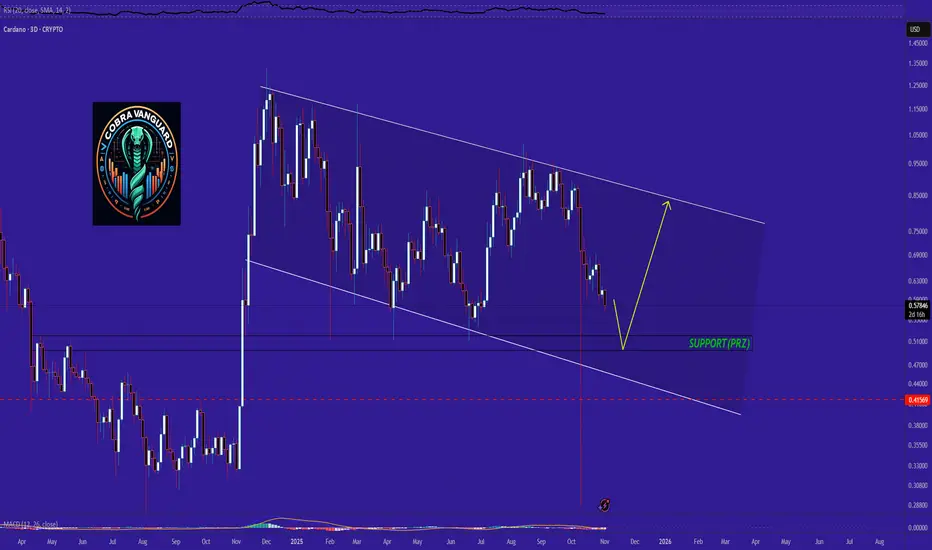
ADA's situation+next targets and expected movementsThe price may drop into the PRZ (Potential Reversal Zone) to fill its previous gap. After that, we can start considering a potential upward move.
Cardano - Realistic take4 separate times that RSI Divergence has occurred in oversold territory has hinted and displayed positive upside shortly after.
*Bullish Shark harmonic could be forming.
My current price to add more: ~.45 range.
No current TP at this time.

ADAUSD corrective pullback supported at 5,928The ADAUSD remains in a neutral trend, with recent price action indicating a corrective pullback within the broader trading range.
Support Zone: 5,928 – a key level from previous consolidation. Price is currently testing or approaching this level.
A bullish rebound from 5,928 would confirm ongoing upside momentum, with potential targets at:
6,600 – initial resistance
6,740 – psychological and structural level
6,900 – extended resistance on the longer-term chart
Bearish Scenario:
A confirmed break and daily close below 5,928 would weaken the bullish outlook and suggest deeper downside risk toward:
5,707 – minor support
5,344 – stronger support and potential demand zone
Outlook:
Neutral bias remains intact while the ADAUSD holds above 5,928 A sustained break below this level could shift momentum to the downside in the short term.
This communication is for informational purposes only and should not be viewed as any form of recommendation as to a particular course of action or as investment advice. It is not intended as an offer or solicitation for the purchase or sale of any financial instrument or as an official confirmation of any transaction. Opinions, estimates and assumptions expressed herein are made as of the date of this communication and are subject to change without notice. This communication has been prepared based upon information, including market prices, data and other information, believed to be reliable; however, Trade Nation does not warrant its completeness or accuracy. All market prices and market data contained in or attached to this communication are indicative and subject to change without notice.

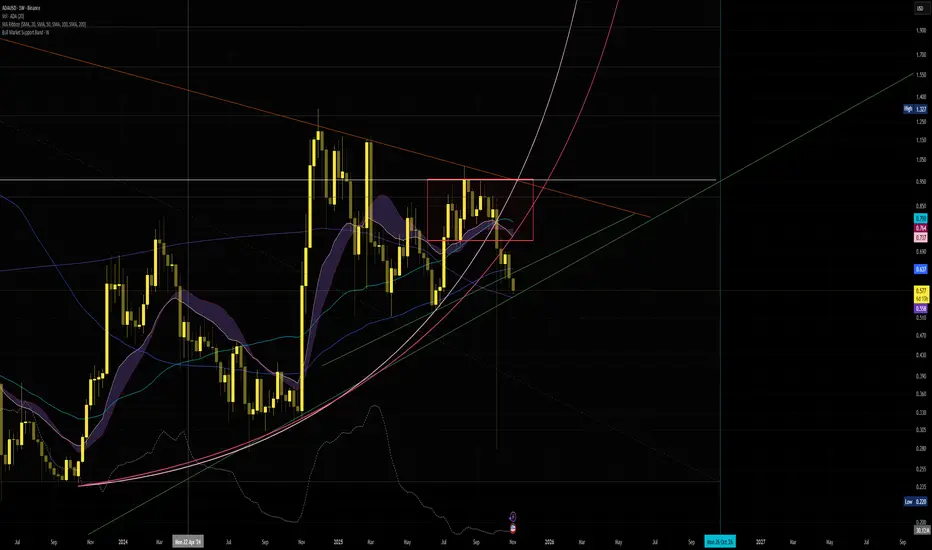
CARDANO Last chance to keep the Bull Cycle running.Cardano (ADAUSD) has been trading within a Channel Up every since its December 26 2022 Bear Cycle bottom. That was also the time the 1W RSI has been at its lowest (hitting 30.00). The most recent bullish signal has been the 1W Golden Cross, its first ever.
Following this however, the price failed to break above the Lower Highs trend-line of the pattern's previous Higher High and got rejected back to its bottom (Higher Lows trend-line), which momentarily got broken on the October 10 flash crash. Still, the market instantly recovered and more importantly the 1W RSI found Support on its own 3-year Higher Lows Zone, which has been the most effective buy entry of the Bull Cycle.
As long as the price stays inside the Channel Up, the Bull Cycle remains alive. The confirmation of further upside, thus a new Bullish Leg, only comes technically if the price breaks above the Lower Highs trend-line again. If it does, we expect a Higher High on the 1.382 Fibonacci extension (every Higher High seems to decline, 1.786 to 1.5 Fib) at $1.900. A 1W candle closing below its 1W MA200 (orange trend-line), most likely confirms the new Bear Cycle.
-------------------------------------------------------------------------------
** Please LIKE 👍, FOLLOW ✅, SHARE 🙌 and COMMENT ✍ if you enjoy this idea! Also share your ideas and charts in the comments section below! This is best way to keep it relevant, support us, keep the content here free and allow the idea to reach as many people as possible. **
-------------------------------------------------------------------------------
💸💸💸💸💸💸
👇 👇 👇 👇 👇 👇

ADAUSD: Swing LOW!ADAUSD has completed Wave 2 and confirmed Trend direction. It has entered into a new unconfirmed S&R zone but we’re still waiting on RSI, EMA and Support crosses. Once those clear I will calculate the ATR and finalize sell areas.
ADA has a standard lot size condition which may be a high leverage for some traders BUT it has a really good ROI so if you have the capital to invest in it that would be a great investment.
Follow me to stay updated with modifications and new trade opportunities.
Have a Prosperous Trade and God Bless

ADAUSD testing pivotal 6890 resistance levelThe ADAUSD remains in a neutral trend, with recent price action indicating a corrective pullback within the broader trading range.
Support Zone: 6,136 – a key level from previous consolidation. Price is currently testing or approaching this level.
A bullish rebound from 6,136 would confirm ongoing upside momentum, with potential targets at:
6,890 – initial resistance
7,090 – psychological and structural level
7,260 – extended resistance on the longer-term chart
Bearish Scenario:
A confirmed break and daily close below 6,136 would weaken the bullish outlook and suggest deeper downside risk toward:
5,640 – minor support
5,395 – stronger support and potential demand zone
Outlook:
Bullish bias remains intact while the ADAUSD holds above 5,916 A sustained break below this level could shift momentum to the downside in the short term.
This communication is for informational purposes only and should not be viewed as any form of recommendation as to a particular course of action or as investment advice. It is not intended as an offer or solicitation for the purchase or sale of any financial instrument or as an official confirmation of any transaction. Opinions, estimates and assumptions expressed herein are made as of the date of this communication and are subject to change without notice. This communication has been prepared based upon information, including market prices, data and other information, believed to be reliable; however, Trade Nation does not warrant its completeness or accuracy. All market prices and market data contained in or attached to this communication are indicative and subject to change without notice.

ADAUSD oversold bounce supported at 5,916The ADAUSD remains in a neutral trend, with recent price action indicating a corrective pullback within the broader trading range.
Support Zone: 5,916 – a key level from previous consolidation. Price is currently testing or approaching this level.
A bullish rebound from 5,916 would confirm ongoing upside momentum, with potential targets at:
6,830 – initial resistance
7,090 – psychological and structural level
7,260 – extended resistance on the longer-term chart
Bearish Scenario:
A confirmed break and daily close below 5,916 would weaken the bullish outlook and suggest deeper downside risk toward:
5,640 – minor support
5,395 – stronger support and potential demand zone
Outlook:
Bullish bias remains intact while the ADAUSD holds above 5,916 A sustained break below this level could shift momentum to the downside in the short term.
This communication is for informational purposes only and should not be viewed as any form of recommendation as to a particular course of action or as investment advice. It is not intended as an offer or solicitation for the purchase or sale of any financial instrument or as an official confirmation of any transaction. Opinions, estimates and assumptions expressed herein are made as of the date of this communication and are subject to change without notice. This communication has been prepared based upon information, including market prices, data and other information, believed to be reliable; however, Trade Nation does not warrant its completeness or accuracy. All market prices and market data contained in or attached to this communication are indicative and subject to change without notice.

ADA PENNANT CONSOLIDATION CHANNELADA is closing a very long consolidation triangle with massive upside potential that I’m guessing will correlate with the government opening back up and the ETFs all getting passed and upcoming rate cuts. 😎😎😎

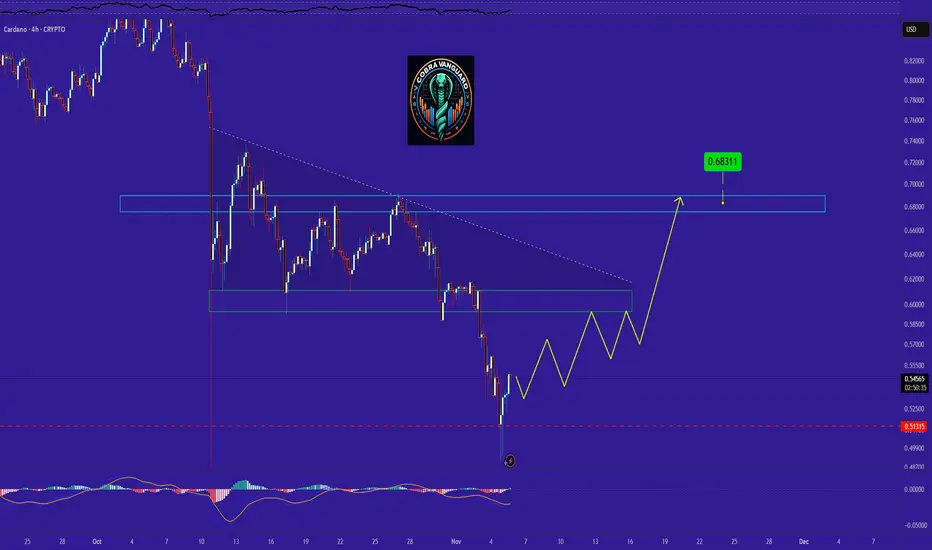
ADA/USD (Cardano) Technical Outlook — Potential Reversal ZoneCardano is currently trading around $0.65, showing early signs of consolidation after a strong bearish move earlier this month.
🟩 Buy Zone: $0.60 – $0.63
This green area represents a major demand zone / support level where price previously found strong buying pressure. If ADA can retest this zone and hold, it could trigger a solid rebound.
🟥 Target Zone: $0.80 – $0.85
The red zone marks major resistance / supply, which could act as the next profit area once momentum shifts bullish.
✅ Possible Setup:
Wait for a dip into the green zone.
Look for bullish confirmation (candlestick pattern or volume increase).
Target the $0.80 area with a stop below $0.59.
📈 The market structure still favors a potential short-term bounce before any larger trend change.
Traders should stay alert for fakeouts or liquidity sweeps before the real move begins.
💬 What’s your take — will ADA bounce from support or break lower first?
#ADA #Cardano #Crypto #TradingView #PriceAction #TechnicalAnalysis #Altcoins

4H H/S Bullish reversal pattern possibility [short-term]4H H/S bullish reversal patten.
If neck-line breaks, potential rise to the ~.80 area.
Similar pattern on XLM/USD & XRP/USD are forming, with a breakout on XRP/USD already confirmed.

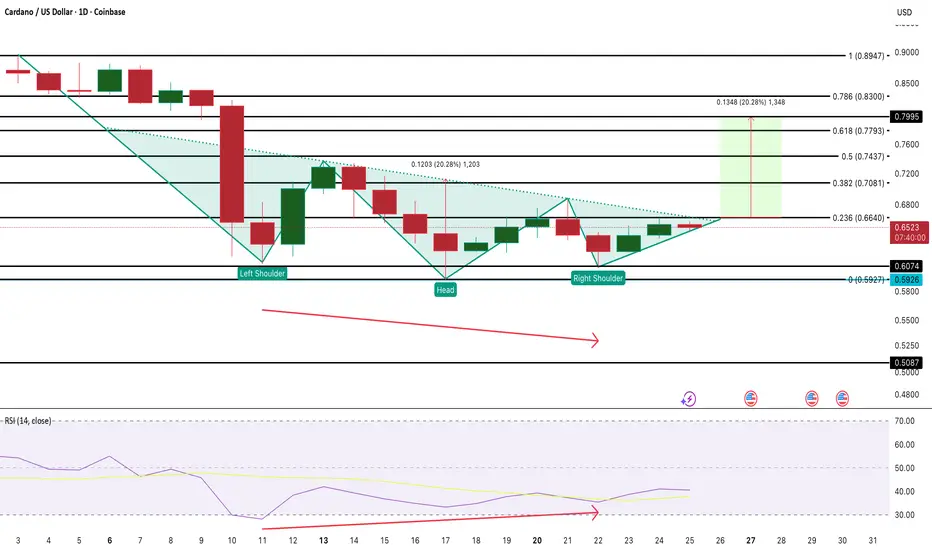
Cardano Price Shows Two Reversal Patterns Amid Slippery SlopeCOINBASE:ADAUSD is testing a key resistance near $0.66, where an inverse head and shoulders pattern has taken shape on the daily chart. The neckline slopes downward, suggesting sellers are still defending, but a daily close above $0.66 could confirm a breakout toward $0.79–$0.83.
The RSI shows a bullish divergence — higher lows in RSI versus lower lows in price between October 11 and 22 — indicating that downside momentum is fading. If ADA slips below $0.60, the setup fails, exposing $0.50 as the next support.
On-chain data offers mild support: whales holding 10M–100M ADA have added about 50 million tokens, and spent coin activity has dropped 36% since mid-October, hinting at early accumulation. Still, a sustained move above the neckline is needed to flip sentiment firmly bullish for the COINBASE:ADAUSD pair.