ANKR 2x-5x LONGANKR 2x-5x LONG
INVERSE Head & Shoulders
Not Financial Advice
This is for Entertainment Only
ANKRUSDT trade ideas

#ANKR/USDT is testing the Diagonal Trendline in 4-Hour TF!#ANKR/USDT is testing the Diagonal Trendline in 4-Hour TF!
$ANKR needs to clear the Diagonal Trendline to gain bullish momentum. Wait for BO/retest to open a long position.

Our attempt to identify the next "pump coin". ANKR long trade #8While the previous few days, the most voluminous and liquidity cryptocurrencies have been falling in value, some coins have been pumping like as: FLM, GTC, PERP, UNFI, Cyber etc...
This trade is our attempt to determine which coin will be the next to "pumping". That is why we halve our standard entry amount to $5000 and emphasize that a stop order is required.
Enter = 0,01841
Stop = 0,01797 ( -2.4%)
TP = 0,02394 ( +30%)
P/L ratio = 12.6
According to these conditions, with a position size of $5000, the amount of potential loss is $120, and potential profit is $1500.
What do you think, "Is this game worth the candle"? Write your thoughts in the comments

Ankr Small Sell TradeHere is My Study On ANKR.
Welcome to my channel! Here you'll find daily technical analysis ofthe latest trends in the crypto market. From Bitcoin to altcoins, I'lIl be sharing my insights and predictions to help you make informed decisions
about your investments. Follow me for the latest updates and join the conversation in the comments!
Crypto technical analysis uses past price history to predict future price. It's not a guarantee and shouldn't be relied on solely for investment decisions. Consider other factors such as market trends, economic strength and
information dissemination. Use with caution.
This Is Not A Finacial Advise

ANKR next 🐻 move Looking danger ⚡ to me 🐱
The trend line even act as parabolic curve 🪝
2.½ yr support target 📌 expecting 35-65% crash easily on COINBASE:ANKRUSD
if u have any idea 💡 comment below

bullishHello friends
The orange zone is the range obtained by ICT style
signal is spot
SL never forget

ankrusdtIt is possible that a five-way decline will be implemented in order to complete the C-wave and end the historical drop in the currency, so let's see what will happen

ANKR/USDTshort term targets are the two blue lines
take profit target 1
take profit target 2
long term target is the resistance of the upper white line

ANKR/USDT upward momentum!!👀🚀Ankr Today Analysis
💎Ankrusdt is making intriguing moves as it neatly follows the overlapping trajectory to reach the bearish Order Block (OB) to tap into additional liquidity.
💎 In the past, it experienced a significant downward shift as the demand turned into supply, further reinforcing the downward movement.
💎 After tapping into the downward liquidity, it set an upward momentum, tapped the OB once, faced rejection, and is now setting up again for upward momentum to tap into the remaining liquidity.
💎 In the dynamic world of crypto, staying informed and adaptable is key. Stay tuned for more updates and enjoy your trading journey

Brief Analysis ——ANKRToday we will share a brief analysis of 3 old-school tokens. They are ANKR, IOTA and LINA.
After the dump in early June, ANKR completed a V-reversal. The price quickly returned to its original position. After that, the bears frequently strengthened, but the price remained within the black angle, and each low is higher than the previous one. This is a bullish signal. The price has exceeded the lower rail of the angle this week, but it has not been confirmed. It may return back in the angle. From the perspective of bulls and bears, the bulls failed to stand on the upper rail of the angle many times and the bears strengthened on Sunday, suppressing the bulls.
Conclusion: Mostly falling. ANKR maintained neutral on a large scale, but it has turned bearish on a small side. We think a downside is more likely. In any case, once the price confirms its direction and breaks through the black angle, then the short-term trend is formed. We set resistance level at 0.029 and support level at 0.019.
If you have any ideas, welcome to communicate with us:)
Disclaimer: Nothing in the script constitutes investment advice. The script objectively expounded the market situation and should not be construed as an offer to sell or an invitation to buy any cryptocurrencies.
Any decisions made based on the information contained in the script are your sole responsibility. Any investments made or to be made shall be with your independent analyses based on your financial situation and objectives.

ANKR LOOKS BULLISH (6H)Hi, dear traders. how are you ? Today we have a viewpoint to BUY/LONG the ANKR symbol.
For risk management, please don't forget stop loss and capital management
When we reach the first target, save some profit and then change the stop to entry
Comment if you have any questions
Thank You


ANKRUSDT UNIQUE IDEA#ANKRUSDT
UPDATE
ANKR is ready for a good bullish wave in this move we can see price around 0.04✍

ANKRUSDT IDEAHello Trading view Family / Fellow Traders.
I hope you have used and benifited from the previous analysis .
In today trading session we are monitoring ANKRUSDT for a buying opportunity, once we will receive any bullish confirmation the trade will be executed.
If this post was useful to you do not forget to like and comment.

ANKRUSDT wants the breakout?ANKRUSDT is currently testing a crucial resistance level situated around the 0.026$ area. This level has proven to be significant in the past, acting as a barrier for the price to overcome.
As per Plancton's Rules, traders would be looking for a clear breakout above the 0.026$ resistance level to initiate a new long position. A breakout occurs when the price convincingly breaches the resistance level, typically accompanied by an increase in trading volume, indicating a surge in bullish momentum.
If the breakout occurs, it would signal a potential bullish trend reversal or continuation. Traders following Plancton's Rules would be anticipating further upward price movement and seeking to capitalize on the potential price appreciation.
–––––
Follow the Shrimp 🦐
Keep in mind.
🟣 Purple structure -> Monthly structure.
🔴 Red structure -> Weekly structure.
🔵 Blue structure -> Daily structure.
🟡 Yellow structure -> 4h structure.
⚫️ Black structure -> <= 1h structure.
Follow the Shrimp 🦐


ANKR Bullish ANKR chart seems positive, you can place a long trade for the current price or wait for an hourly close above the entry zone on the chart. Stop-loss => 4H close below the defined price.

ANKR - Still correcting
My previous wave count continues valid, but I´m not confident wave 4 is finished yet. We may be looking at something more complex than a zigzag, such as a griangle or flat correction.
In any case, my outlook is bearish for a new lower low below 0.017 (wave 5), and I´ll only be taking short trades in smaller timeframes.


ANKRUSDT is testing the key levelThe current price action of ANKRUSDT indicates an interesting development as it tests the weekly resistance level. This resistance level has significance in the market as it has previously prevented the price from moving higher.
After an initial attempt at breaking out above the resistance level, the price of ANKRUSDT has retraced back to test it again. This suggests that the market is in a critical phase, awaiting further confirmation for a clear breakout. One important factor that is needed for a successful breakout is increased volume. Higher trading volume can provide additional momentum and market participation, indicating a stronger trend.
According to Plancton's Rules, a potential trading opportunity could arise if ANKRUSDT manages to break out above the resistance level at 0.026. This level serves as a key threshold that, if surpassed with sufficient volume, could indicate a new bullish trend. Traders adhering to Plancton's Rules might consider opening long positions once the breakout is confirmed.
In terms of price targets, the first target for the long position could be set at 0.029. This level represents a potential area of significant resistance or a subsequent price target where traders might consider taking profits or reassessing the market conditions.
–––––
Follow the Shrimp 🦐
Keep in mind.
🟣 Purple structure -> Monthly structure.
🔴 Red structure -> Weekly structure.
🔵 Blue structure -> Daily structure.
🟡 Yellow structure -> 4h structure.
⚫️ Black structure -> <= 1h structure.
Follow the Shrimp 🦐

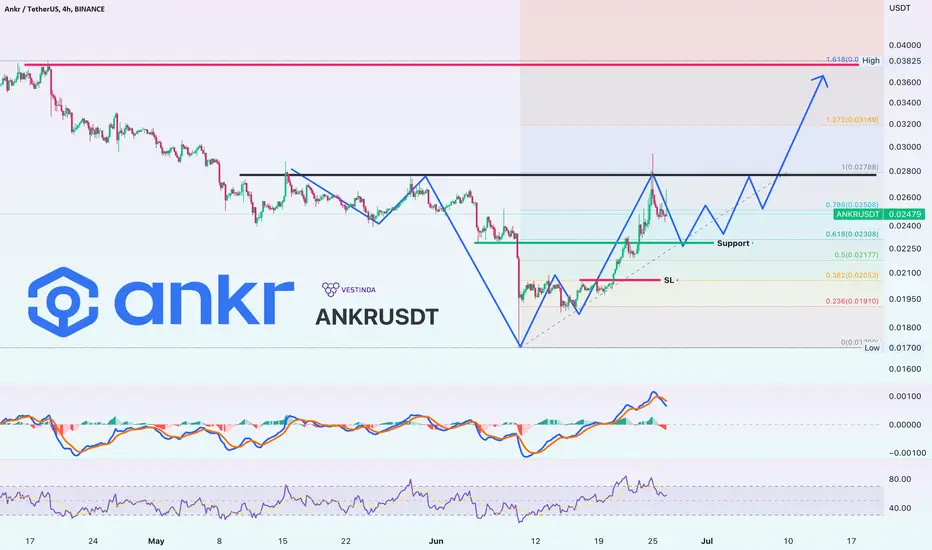
Ankr ANKRUSDT Price Analysis (4h)After experiencing a sharp drop in early June, the price of ANKR is currently rebounding.
The swing low occurred at $0.017, followed by a surge up to $0.029, marking a remarkable increase of +70%. As the price stabilizes, we anticipate a period of consolidation with potential support around the Fibonacci retracement level of approximately $0.023, indicating a trending market.
Furthermore, it appears that ANKR is forming an Inverted Head and Shoulders pattern, a bullish reversal pattern that suggests a potential booming phase.
This pattern, combined with recent fundamental news of ANKR partnering with Tencent, the largest entertainment and telecommunications company in China, raises expectations for future growth.
Be on the lookout for a strong price pump!
ANKR forming cup and handles ANKR is forming a cup and handles pattern in 4H time frame. Upon confirmation it can go up to 0.033, you can open long position at 0.024 at your own risk!
