✳️ Aragon Finds Support (Next Target Mapped)Here we have this support level strongly depicted on the chart in yellow... This support has been activated and holding for more than three months.
— Let's have a look at Aragon vs Bitcoin | ANTBTC —
There is potential for a bounce here for two reasons mainly: (1) The fact that this is the 0.618

ANT/BTC - Aragon Network: Elliott_Wave_12345◳◱ Hey traders, we've identified an Elliott Wave 12345 pattern on the UPCOM:ANT / CRYPTOCAP:BTC chart. This pattern is a bullish indication and could indicate a potential trend reversal. The next resistance key levels are at 0.00015821 | 0.00017552 | 0.00020388 and the major support zones are re

ANTBTC Tracing Promising Uptrend Potential⚪ In April, ANTBTC underscored the significance of the 7960 satoshis support level, with robust buyer interest evident. This trend persisted, recurring multiple times since January 2021. Subsequently, from April onward, the price has maintained a consistent uptrend trajectory, enclosed within a mega

Ant short ideaAnt close to resistance zone also stoch rsi giving decline signal for future. It could give profit us a short position in usdt parity
Entry: 0.00017153
Stop : 0.00017528
Target: 0.00015556

antusdt short ideaas you see in chart, rsi has negative mismatch also volume declining and open interests heavily on short side. also notional value of open interests more than total contratc value. i believe this it is indicator that price can drop near future.

#ANT/BTC - Long - Potential 6.99%Direction: Long
Market: Spot
Risk: 0.25% - 1%
#BTC_ANT
Exchange: BINANCE
Timeframe: 360
TP1: 0.00014534
Entry: 0.0001367
STOP: 0.00012806
Entry Conditions:
| Double resistance break on the RVOI - (historically these breaks have given good price pumps)
| Uptrend - over 20&50MA's
| BTC look

✳️ Aragon Aims At New High After...We have two long months of sideways consolidation, this prepares ANTBTC (Aragon) to continue growing.
After the new high was hit 4-Dec 2022, we see just sideways action combined with higher lows.
This is a strong bullish signal because when prices are set to drop, they drop... Here Aragon remains

ANT - Possible breakout from rangeCurrently the market is unpredictable so I recommend limiting the risk - while there are gems that technically show us that it is worth trying

$ANTat minor resistance which it needs to flip otherwise goto dotted line
can move quickly , doubt we get the pull back however if we do hop on .
all the best to those in it :)

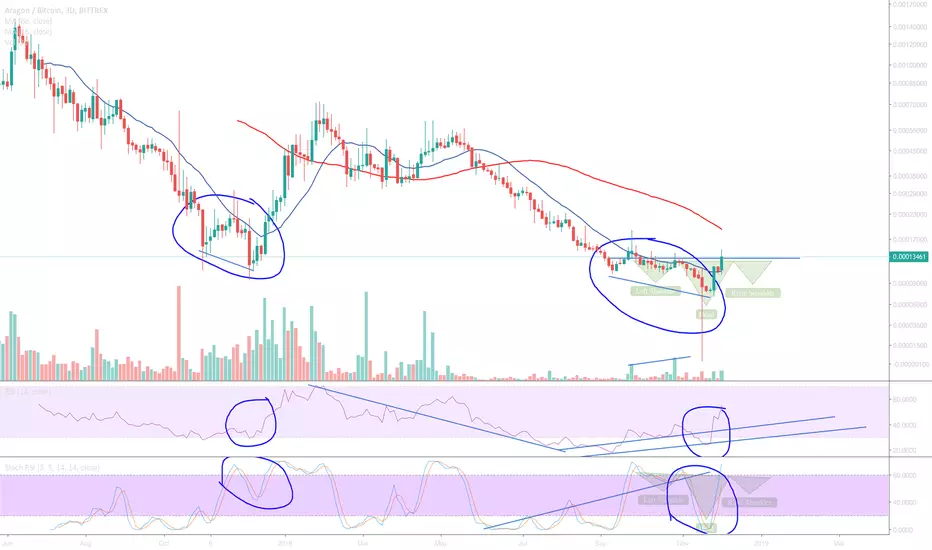
Aragon about to explode?So many interesting signals. Not to mention almost to the week this time last year the volume shot up on the same set up. RSI and Stochastic charts showing higher lows, support on 3-day bottoming candle now confirmed.
See all ideas