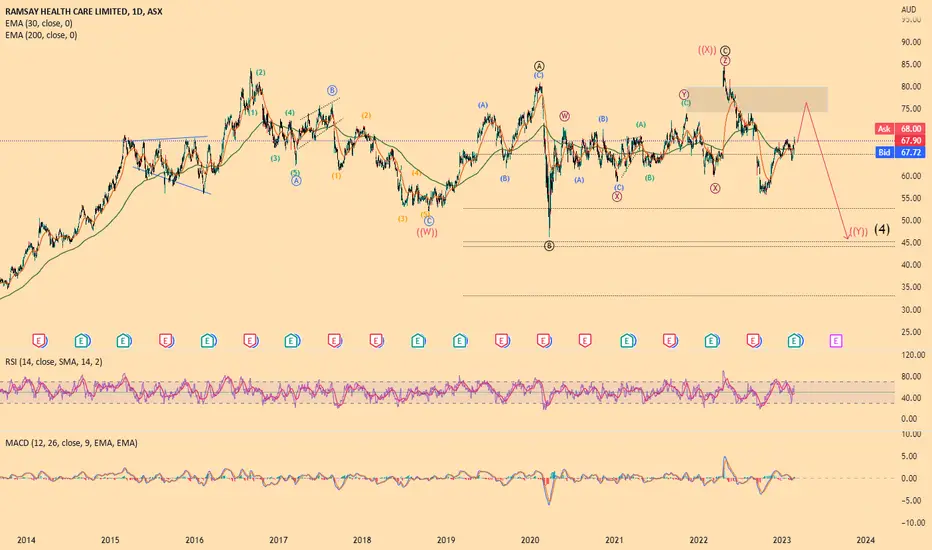
RHCA very long consolidation of a larger wave 4 still in progress. The final leg y of (wxy) will end in a zigzag pattern that indicates the completion of wave 4.
3.708AUD
298.10 MAUD
14.98 BAUD
180.87 M
About RAMSAY HEALTH CARE LIMITED
Sector
Industry
CEO
Craig Ralph McNally
Website
Headquarters
Sydney
Employees (FY)
89 K
Founded
1975
ISIN
AU0000RHCPA4
FIGI
BBG0000088T1
Ramsay Health Care Ltd. engages in the healthcare services and the operation of hospitals and day surgery facilities. It operates through the following geographical segments : Asia Pacific, UK, France and Nordics. The company was founded by Paul Joseph Ramsay in 1964 and is headquartered in Sydney, Australia.
RHC is chopping around and looking for resistance RHC has been chopping around between 61-70 since april last year. a recent surge of 3 bullish candles now sees price coming up against resistance area at $68. a clear break above should see an easy run up to $70. If it struggles to break 68 area i'd be looking for a return to low 60's. for now i'm k


RHC - The trend is your friendHey guys welcome back, as promised here is the first of three charts I have this weeks. Give me a follow if your liking the charts so far. Thumbs up and comments are also appreciated.
I have broken the chart down into a general reversal situation. Sell off. Accumulation. Breakout. Retest. Continu

Gap and GO weekly breakoutfrom bearish to bullish trend due to gap and go, bullish macd cross and rsi trend. strong vol

$RHC.AX #RamsayHealthcare looks bullish abv 56 its 61$RHC.AX #RamsayHealthcare looks bullish abv 56 its 61

ASX: RHC Ramsay Healthcare - Right shoulder forming or not?Ramsay Healthcare is currently in a falling channel . Is it time to buy? After today's capitulation, we are already at the bottom of the channel and also the completion of the Head. Are we seeing a right shoulder forming in the weeks to come?
If we do not fall off the channel, we should bounce and


See all ideas
Trade directly on the supercharts through our supported, fully-verified and user-reviewed brokers.


Frequently Asked Questions
The current price of RHCPA is 106.610 AUD — it has decreased by 0.36% in the past 24 hours. Watch RAMSAY KPYR6QT stock price performance more closely on the chart.
Depending on the exchange, the stock ticker may vary. For instance, on ASX exchange RAMSAY KPYR6QT stocks are traded under the ticker RHCPA.
RHCPA stock is 0.37% volatile and has beta coefficient of 0.03. Track RAMSAY KPYR6QT stock price on the chart and check out the list of the most volatile stocks — is RAMSAY KPYR6QT there?
Yes, you can track RAMSAY KPYR6QT financials in yearly and quarterly reports right on TradingView.
RHCPA stock has fallen by 0.07% compared to the previous week, the month change is a 0.58% rise, over the last year RAMSAY KPYR6QT has showed a 2.56% increase.
RHCPA net income for the last quarter is 758.50 M AUD, while the quarter before that showed 103.70 M AUD of net income which accounts for 631.44% change. Track more RAMSAY KPYR6QT financial stats to get the full picture.
Today RAMSAY KPYR6QT has the market capitalization of 11.46 B, it has decreased by 2.44% over the last week.
Yes, RHCPA dividends are paid semi-annually. The last dividend per share was 3.33 AUD. As of today, Dividend Yield (TTM)% is 1.30%. Tracking RAMSAY KPYR6QT dividends might help you take more informed decisions.
RAMSAY KPYR6QT dividend yield was 1.33% in 2023, and payout ratio reached 59.95%. The year before the numbers were 1.32% and 83.38% correspondingly. See high-dividend stocks and find more opportunities for your portfolio.
Like other stocks, RHCPA shares are traded on stock exchanges, e.g. Nasdaq, Nyse, Euronext, and the easiest way to buy them is through an online stock broker. To do this, you need to open an account and follow a broker's procedures, then start trading. You can trade RAMSAY KPYR6QT stock right from TradingView charts — choose your broker and connect to your account.
RHCPA reached its all-time high on Dec 27, 2019 with the price of 110.800 AUD, and its all-time low was 87.000 AUD and was reached on Mar 23, 2020. View more price dynamics on RHCPA chart.
See other stocks reaching their highest and lowest prices.
See other stocks reaching their highest and lowest prices.
As of May 13, 2024, the company has 89.00 K employees. See our rating of the largest employees — is RAMSAY KPYR6QT on this list?
Investing in stocks requires a comprehensive research: you should carefully study all the available data, e.g. company's financials, related news, and its technical analysis. So RAMSAY KPYR6QT technincal analysis shows the buy rating today, and its 1 week rating is buy. Since market conditions are prone to changes, it's worth looking a bit further into the future — according to the 1 month rating RAMSAY KPYR6QT stock shows the buy signal. See more of RAMSAY KPYR6QT technicals for a more comprehensive analysis.
If you're still not sure, try looking for inspiration in our curated watchlists.
If you're still not sure, try looking for inspiration in our curated watchlists.
EBITDA measures a company's operating performance, its growth signifies an improvement in the efficiency of a company. RAMSAY KPYR6QT EBITDA is 1.88 B AUD, and current EBITDA margin is 11.02%. See more stats in RAMSAY KPYR6QT financial statements.