ATOM Short on retracementThere are 3 best prices to look for an short opportunity/
We are still in bearish bias, so we should consider any movement up - as an opportunity to short!
Always wait for a reaction on this levels!
ATOMUSDT trade ideas

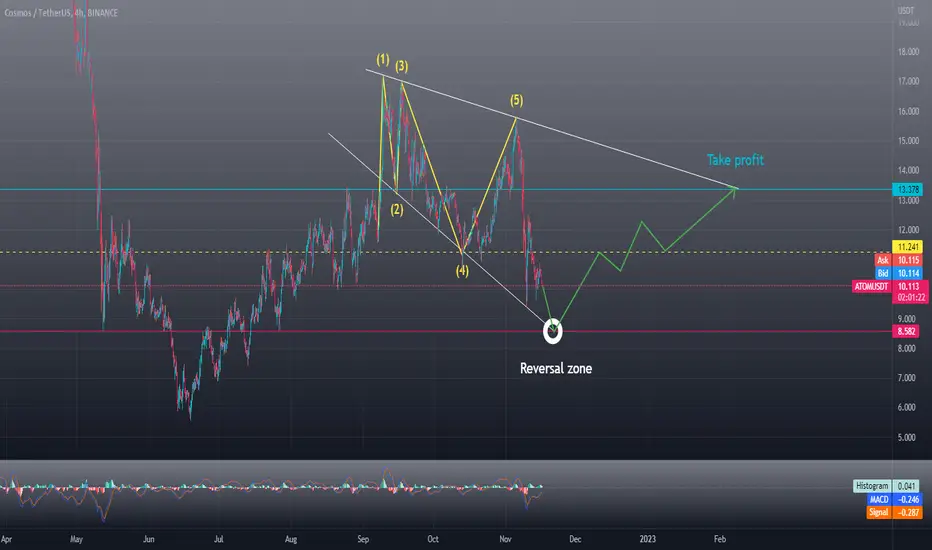
ATOMUSDT Elliott Waves AnalysisHello friends.
Please support my work by clicking the LIKE button👍(If you liked). Also i will appreciate for ur activity. Thank you!
Everything on the chart.
growth from current price or through one more decline in zone ~8.5$
Entry: market and lower
Target: 15 - 19 - 22 and maybe even ~25
after first target reached move ur stop to breakeven
Stop: (depending of ur risk). ALWAYS follow ur RM .
risk is justified
Good luck everyone!
Follow me on TRADINGView, if you don't want to miss my next analysis or signals.
It's not financial advice.
Dont Forget, always make your own research before to trade my ideas!
Open to any questions and suggestions.

#Comos #atom long if stays above $10.25#ATOM #COSMOS
My trade setup
Long if Stay above $10.25
Targets: $12.30, $14 and $15.85 (extended target)

ATOMUSDTAtom created bullish divergence on Daily time-frame...and traded up...now we have 4h FVG below and Equal Highs above with FVG above Equal Highs...I want it to trade down into 4H FVG for entry.

$ATOM Cosmos Bullish GartleyHolding above a critical level on ATOM, 9$ was a top August 2020, and a bottom last July, historically the next level up would be around 14, and $22 above that.
Possible Bullish Gartley completing at the 1.272 retracement from our September highs with bullish divergence locally on the RSI on the daily and 4hr.
The weekly shows a weaker drive of divergence as well, and the MFI could be setting up for hidden divergence.
No real confirmation just yet, but something to keep an eye on, so long as it holds up here.

ATOMUSD ❕ under the point of controlPrice and RSI chart formed a bearish divergence confirmed by trading volumes (1H TF)
ATOM tests 200EMA as resistance (1H TF)
I expect price to fall after fixing below the lower boundary of the range.


ATOMUSDTH&S on Momentum.
Decent Volume coming on Sell side.
Break of Trendline Likely.
0.618 retrace is the target

ATOM Idea: The price has broken the lower border of the descending triangle. The price will bounce to the lower border of the pattern to retest the resistance level, then the downtrend will continue

[LONG] possible relief rally on atomatom is looking good for a bounce
This setup could play out over the weekend, is a short term trade, take profits along the way and don't be afraid to close early.
entry: $9.95
SL: $9.49
TP1: $10.80
TP2: $1.90
R:R 4.24

ATOMUSDTTwo important ranges for spot buying: 8.549 and 7.070
❌These analyzes are just to give a better perspective for you dear ones
Do not base on buying and selling❌

long entrycosmos is at an important level of 4HR and daily support
Entry at current level = 9.866
SL at daily & 4 HR support= 9.73
TP1 at fib0.236 level= 10
TP2 at 4 hour Resistance = 10.13

LONG AREA 10.550 is first tp and mostly close at thereLow risk 1R long area. market should go test there. good luck

ATOM - finding support?I think ATOM chops around here for a bit in yellow - this was my target area for the drop if it lost green, which happened.
Not sure if this area will hold on a macro scale or not, but theoretically shouldn't slice straight through it and would consider longing this area if a setup is provided.
Vatsik

ATOMUSDT | SYMMETRICAL TRIANGLEATOMUSDT has ben trading with in a symmetrical triangle. The price has break above the symmetrical triangle.
The bulls need to sustain price above the triangle.
Trade your levels accordingly.

🔥 ATOM Bearish TriangleATOM, previously one of the better performing alts, has been selling off hard recently.
In my view, there's likely more downside for this token. Personally, I'm waiting for the triangle to break out on the bearish side.
First target at the most recent capitulation low, second at $8.

ATOMUSDT 1HATOM 1H Supports and Resistances
suports: 9,961 / 9,787
resistances: 10,102 / 10,200 / 10,277


ATOM/USDT longwaiting for CHoCH on 5-15m tf and open long , follow the risk management and don't forget to put stop loss

COSMOSThe news background in the cryptocurrency market creates pressure on the price. Top cryptocurrencies show price decline. The panic that began in the market due to the situation with the FTX exchange provoked great distrust in the crypto industry sector. Cryptocurrency ATOM also shows a decline, which I think has not ended yet. But there is hope for the New Year's rally, which can partially save the situation.
Atomic bombBased on the broken trendline, I do not expect ATOM to create a new high. A new low may mean. bullish divergence. Prepare to short at resistance.


Cosmos (ATOM) - November 15Hello?
Traders, welcome.
If you "Follow", you can always get new information quickly.
Please also click "Boost".
Have a good day.
-------------------------------------
(ATOMBTC 1W chart)
If it is supported in the 0.005 440 ~ 0.0006 266 section, it can be seen that the power of the rise is large.
--------------------------------------
(ATOMUSDT 1W Chart)
It declined in the important zone of 12.887-15.083.
The volume profile section and the HA-Low indicator are passing through the 8.060-9.603 section, so if supported in this section, it is likely to turn into an uptrend.
(1D chart)
The important thing is whether you can rise to the 12.887-15.083 section and be supported.
If not, you need to make sure it is supported in the 8.060-9.603 section.
Therefore, it is necessary to check whether there is a movement out of the 9.603-12.887 range due to the volatility around November 21st.
-------------------------------------------------- -------------------------------------------
** All descriptions are for reference only and do not guarantee profit or loss in investment.
** If this chart is shared, you can use the indicators normally.
** The MRHAB-T indicator includes indicators that indicate points of support and resistance.
** HA SRRC indicators are displayed as StochRSI (line), RSI (columns), and CCI (bgcolor).
** The CCI indicator is displayed in the overbought section (CCI > +100) and oversold section (CCI < -100).
(Short-term Stop Loss can be said to be a point where profit or loss can be preserved or additional entry can be made by split trading. This is a short-term investment perspective.)
---------------------------------
