ATOMUSDT trade ideas

descending trianglea pure chart pattern on ATOMUSDT, its more clear on D1 TF, there you will monitor the breakout, also keep an eye on BTC performance aswell.

Cosmos (ATOM) - October 27Hello?
Welcome, traders.
By "following", you can always get new information quickly.
Please also click "Boost".
Have a good day.
-------------------------------------
(ATOMUSDT 1W Chart)
Whether the 12.282-15.837 section is supported and able to rise is the key.
(1D chart)
The key is to find support at or above the 11.377-12.282 zone and move higher than 15.083.
Otherwise, it is expected to fall below 9.603.
If it is supported and rises in the 15.083-18.837 section, it is expected to rise to around 22.948.
------------------------------------------------------------ -------------------------------------------
** All descriptions are for reference only and do not guarantee a profit or loss in investment.
** If you share this chart, you can use the indicators normally.
** The MRHAB-T indicator contains indicators that indicate support and resistance points.
** SR_R_C indicators are displayed as StochRSI(line), RSI(columns), CCI(bgcolor).
** CCI indicator is expressed as overbought range (CCI > +100) and oversold range (CCI < -100).
(Short-term Stop Loss can be said to be a point where profit and loss can be preserved or additional entry can be made through split trading. It is a short-term investment perspective.)
---------------------------------

ATOM LONG (Day Trade)I like Atom here making higher lows.
Would take this long if it gets triggered.
Valid only for the next 24 hours.

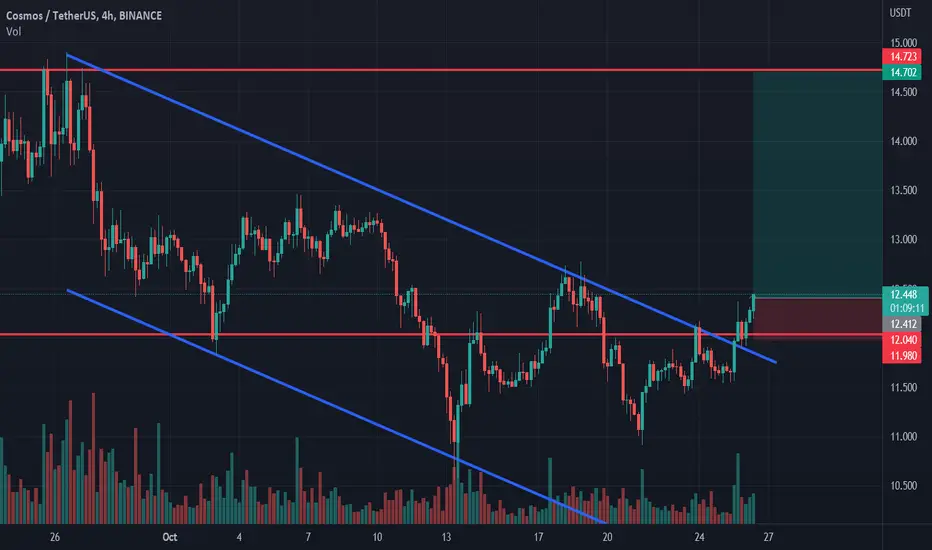
Cosmos longCosmos broke trough off the upper boundary of descending channel. Asset broke trough off the resistance level. Bullish movement to resistance level at 14.7 is expected to happen.
ATOMUSDTHello Crypto Lovers,
Mars Signals team wishes you high profits.
This is a one-day-time frame analysis for ATOMUSDT
As we analyzed on October 11, we expected a falling trend to happen and in the current chart, our prediction came true and one of our targets is hit. Here we have R2 and R1 as the resistance areas that express the unsuccessful attempts of price to rise. S2 used to be a resistance line and S1 is our long-term support line. At the moment, we have the fluctuation of price below R1 and there are two options for it to happen. In case we have some confirmation candles to rise, an increase is predicted for the price up to R2 and again a rejection will happen after that. But if the price loses the support at R1, we should wait for a decline down to S1 or more. Please activate your stop-loss points for less risky trades.
Warning: This is just a suggestion and we do not guarantee profits. We advise you to analyze the chart before opening any positions.
Wish you luck

Short ATOMATOM is the best large cap crypto which outperformed almost other ones since mid June. However, the hype was not maintained, as with other cryptos in this bear market.
In 2D TF, the prices had broken the ascending channel and already lost 10% from the breaking point.
Volume indicators MFI and OBV had also broken their trendlines. Moreover, CMF crossed "0" with continously declining buy pressure.

✅TS ❕ ATOMUSD: bounced off✅✅ ATOM bounced off the resistance level.
The price has already bounced off the level several times.
I'm expecting a fall.✅
🚀 SELL scenario: short to 11.🚀
----------------------------------------------------------------------------
Remember, there is no place for luck in trading - only strategy!
Thanks for the likes and comments.

$ATOM and every altcoin$ATOM but every altcoin is looking like this there are three possible scenarios that can happen IMO the third is most likely to happen but lets see

long entryafter the bearish trend on hourly chart
the trend turns to bullish after the recent LL is formed above the previous LL

ATOMUSDT shortwaiting for CHoCH on 5-15 min and open short , follow the risk management and don't forget to put stop loss

ATOM Trend Broken!!KEY Levels mapped!
Love it or hate it, hit that thumbs up and share your thoughts below!
Every day the charts provide new information. You have to adjust or get REKT.
Don't trade with what you're not willing to lose. Safe Trading, Calculate Your Risk/Reward & Collect!
This is not financial advice. This is for educational purposes only.

ATOMusdt 12H TrendLine & Resistance According to the chart, the upward trend line has broken down and is close to the resistance zone. If this area is maintained, we expect the possibility of falling to support, and otherwise, the analysis will be updated with the break of the trend line.
Its not Buy or Sell SIGNAL
DYOR
BY : M.TeriZ - @AtonicShark


ATOM USDT Hello my frinds
i think this week we start a new trand
i hope you all enjoy this signal for futuer and spot

ATOMUSDT 4HATOMUSDT - Perfect triangular formation, you can still fetch the lower edge of the triangular base at $10,921. Here are its next supports and resistances:
S: 10,921 / 10,559
A: 11,855 / 12,091 / 12,789 / 13,108
