AUDCAD trade ideas

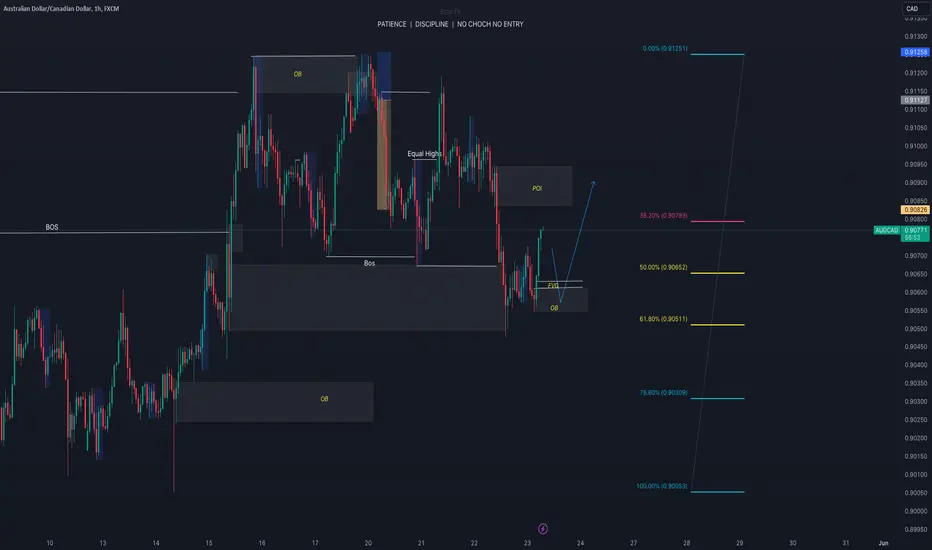
AUDCADEntry for sells on the 1hr (1:3)
after the break of structure, waited for the price to retest the 50% fib level.

AUDCAD - TRIPLE TOP 📉Hello Traders !
On Wednesday 15 May, The AUDCAD reached a resistance level (0.90994 - 0.91174).
The price formed a triple top pattern.
At the moment, the neckline is broken.
The support line is broken.
So, i expect a bearish move📉
---------------
TARGET: 0.90295🎯

AUDCAD in bullish trend AUDCAD in bullish trend expected breakout according to sentiments short play


AUDCAD analysisIn case of failure, the sales transaction range will be activated! Please be careful!

AUDCADH&S formed that's a reversal pattern & it has now been broken & retested making past support future resistance, there's also an engulfing bearish candle on H2.

Sell AUDCAD Symmetrical TriangleThe AUD/CAD pair on the M30 timeframe presents a Potential Selling Opportunity due to a recent breakout from a Triangle Pattern. This suggests a shift in momentum towards the downside in the coming hours.
Possible Short Trade:
Entry: Consider Entering A Short Position below The Broken Trendline Of The Triangle After Confirmation. Ideally, This Would Be Around 0.9070.
Target Levels:
1st Support – 0.9028
2nd Support – 0.9007
Stop-Loss: To manage risk, place a stop-loss order above 0.9090. This helps limit potential losses if the price falls back unexpectedly.
Bearish Breakdown:
Triangle Breakout Retest: The price action recently broke above a bullish triangle, indicating a potential uptrend. However, it has now returned to retest the broken resistance line of the triangle. This retest often precedes a reversal.
Ichimoku Cloud Resistance: The price is currently hovering near the Ichimoku cloud, which can act as a resistance zone. A rejection from this area could further strengthen the bearish case.
Thank you.

RANGE ENTRYPrice now being in a 30M range we’re patiently waiting for a Bos within the range to push price lower before the CAD cpi news comes in for a buy

AUDCAD Bearish Harmonic Pattern - Strategic Trade SetupThe AUDCAD pair is currently exhibiting a Bearish Harmonic Pattern (XABCD), with Point D anticipated to act as a Potential Reversal Zone (PRZ). This analysis aims to identify strategic entry and exit points based on the confluence of multiple technical indicators.
Key Technical Indicators
Potential Reversal Zone (PRZ):
Point D aligns with a significant Key Resistance area, which historically serves as a strong barrier to upward price movement.
4-hour Trend Line:
The trend line, which has acted as a pivotal point in previous market movements, intersects at Point D, reinforcing the likelihood of a reversal.
Bearish RSI Divergence (1-hour):
The Relative Strength Index (RSI) on the 1-hour chart displays a bearish divergence, suggesting weakening bullish momentum and potential for a bearish reversal.
Trade Setup
Entry Point:
A strategic entry is recommended at 0.91113, where the confluence of the aforementioned technical factors indicates a high probability of a trend reversal.
Stop Loss:
To mitigate risk, a stop loss should be placed at 0.91261, slightly above the resistance level to avoid false breakouts.
Take Profit Levels:
TP-1: 0.90964
The first take profit level is set at 0.90964, capturing initial downward momentum and ensuring partial profit realization.
TP-2: 0.90816
The second take profit level at 0.90816 aims to capitalize on further bearish movement, aligning with intermediate support zones.
TP-3: 0.90668
The final take profit target at 0.90668 corresponds to a more significant support level, maximizing potential gains from the bearish trend reversal.
Conclusion:
Based on the technical analysis, the AUDCAD pair presents a compelling bearish setup with multiple converging indicators at Point D. The proposed entry at 0.91113, supported by a precise stop loss and structured take profit levels, offers a well-balanced risk-reward ratio. Traders are advised to monitor price action closely as it approaches the PRZ to confirm bearish momentum before executing the trade.

AUDCAD - Accumulation phase ✅Hello traders!
‼️ This is my perspective on AUDCAD.
Technical analysis: As we can see here price is in a range for the last couple of days, so I expect we can see a manipulation of sell side liquidity and then price to reject from FIBO 0.618 level for distribution.
Like, comment and subscribe to be in touch with my content!

AUDCAD is approaching a significant supportHey Traders, in today's trading session we are monitoring AUDCAD for a buying opportunity around 0.90600 zone, AUDCAD is trading in an uptrend and currently is in a correction phase in which it is approaching the trend at 0.90600 support and resistance area.
Trade safe, Joe.

Heading into 61.8% Fibonacci resistance?AUD/CAD is rising towards a resistance level which is an overlap resistance that aligns with the 611.8% Fibonacci retracement and could potentially reverse from this level to our take profit.
Entry: 0.90910
Why we like it:
There is an overlap resistance level that lines up with the 61.8% Fibonacci retracement.
Stop loss: 0.91189
Why we like it:
There is a pullback resistance level.
Take profit: 0.90489
Why we like it:
There is a pullback support level.
Please be advised that the information presented on TradingView is provided to Vantage (‘Vantage Global Limited’, ‘we’) by a third-party provider (‘Everest Fortune Group’). Please be reminded that you are solely responsible for the trading decisions on your account. There is a very high degree of risk involved in trading. Any information and/or content is intended entirely for research, educational and informational purposes only and does not constitute investment or consultation advice or investment strategy. The information is not tailored to the investment needs of any specific person and therefore does not involve a consideration of any of the investment objectives, financial situation or needs of any viewer that may receive it. Kindly also note that past performance is not a reliable indicator of future results. Actual results may differ materially from those anticipated in forward-looking or past performance statements. We assume no liability as to the accuracy or completeness of any of the information and/or content provided herein and the Company cannot be held responsible for any omission, mistake nor for any loss or damage including without limitation to any loss of profit which may arise from reliance on any information supplied by Everest Fortune Group.

Short AUDCAD1. Bearish divergence on 4H
2. Double Top
2. LL and LH formation
3. Fib 0.5
4. Bearish trendline
5. Entry on retracement

AUDCAD: OutlookAUDCAD biased on bearish side. Forming Continuity bearish flag pattern.
Forecasted price 0.90121

Aud Cad is ripe for a sell now it hip a Monthly Pivot of 0.91048Aud Cad is ripe for a sell now it hip a Monthly Pivot of 0.91048 and now it has a 4hrs candle closed below the Pivot point its heading to hit 0.87881 another monthly pivot point , please apply proper risk managemant.


AUD CAD LONG ENTRYAud cad completed a 3 wave down and now heading for a continuation move to the upside. Rsi is also showing a divergence on h4 to confirm my bias. Let me know if you have any questions regarding my analysis. Trade safe Goodluck!

AUDCAD forming double topAUDCAD has formad a double top with divergence which indicated a reversal pattern.

AUDCAD TREND BREAKOUT AND CONTINUATIONThe AUDCAD pair has confirmed a trend breakout, and we are currently observing hourly consolidation forming within a flag pattern. This suggests potential further downside momentum, reinforced by the bearish signals for this pair. We anticipate continued selling pressure, likely bringing the pair back to the highlighted key level.

AUDCAD high probability setupBefore price's previous break, it was in a consolidation where it eventually swept liquidity below support. It preceded to push to the upside with massive momentum where it eventually consolidated again, forming liquidity above an external range double top(or head and shoulders) and below an internal range support. Since price is currently in a bullish trend, it could look to clear out this internal range liquidity first before clearing the external range liquidity and breaking further to the upside. This gives as an opportunity of a trend following entry, which is an identified golden zone below the identified internal range liquidity with a tp target of the latest high.

✅AUD_CAD TIME TO SELL|SHORT🔥
✅AUD_CAD made a bearish
Pullback from the horizontal
Resistance of 0.9077 so we
Are bearish biased and we
Will be expecting a further
Local move down
SHORT🔥
✅Like and subscribe to never miss a new idea!✅

idea on a chartWW have a great set up where price could possible go AUDCAD price ended the recent bullish rally by facing the major resistance at 0.9125, to form solid obstacle against recording any new positive target and notice the beginning of activating the correctional bearish track and settling near 0.9060.
Now, stochastic decline towards 50 level will increase the negative pressures on the price, allowing us to suggest more negative attempts and wait to target 0.9020 and 0.8990 levels.