AUDCAD : Long Trade , 4hHello traders, we want to check the AUDCAD chart. The price is moving in an ascending channel and has pulled back to the indicated key level. We expect this level to play the role of a support level and the price will grow to around 0.89000. Good luck.
AUDCAX trade ideas

Retest of structureIm long here. We are at an important level where australia bank rises cash rate last time.

AUDCADOANDA:AUDCAD BUY AND SHORT position can be taken in the specified area
There is no position before the area

AUDCAD IS MAKING WAGE WITH BEARISH DIVERGENCEAUDCAD is making rising wage with bearish divegence centiments also show bearish trend so accourding to my analysis bearish trend will start on 1H time frame my trade plane mentioned in chart

Journal Series - AUDCADDisclaimer: The trade idea presented herein is solely for journaling purposes and does not constitute investment advice or a recommendation to buy, sell, or hold any securities or financial instruments. The information provided is based on hypothetical scenarios and past performance, which may not be indicative of future results. Investors should conduct their own research and consult with a qualified financial advisor before making any investment decisions. The author and publisher of this content shall not be held liable for any losses or damages resulting from the use of this information. Trading and investing involve risks, and individuals should carefully consider their risk tolerance and financial situation before engaging in any trading activities.

AUD/CAD SELL STOP at .8850AUD/CAD is carving out a classic M-Top candle pattern at resisance so a break of the neckline at .8850 will be a confirmed SELL.
M-Tops and W-Bottoms are proof that you don't need indicators to trade.
Indicators obviously help and I use them - but you don't NEED them.
You'll be a successful trader if you just traded M-Tops and W-Bottoms.
These patterns are traditionally traded on a 1:1 ratio with the STOP taken from the neckline to the top of the pattern and the TAKE PROFIT at 1:1 so the STOP is .8879 and the TP is .8819.
As ever, these levels are not set in stone and you should always micro manage your trades and if you reach your take profit and the momentum is still with the position then adjust you TP accordingly.
Similalrly with STOPS. A STOP is not necessarliy a line in the sand that should not be crossed.
If price bounces but the overall structure is still in place then by all means squeeze the SL a bit higher rather than lose but be mindful that there MUST BE a line in the sand if price is continuing north and your're SHORT.
The old adage "let your winners run and shut down your losers early" is for ever true.


AUDCAD 1H (sell)Hi
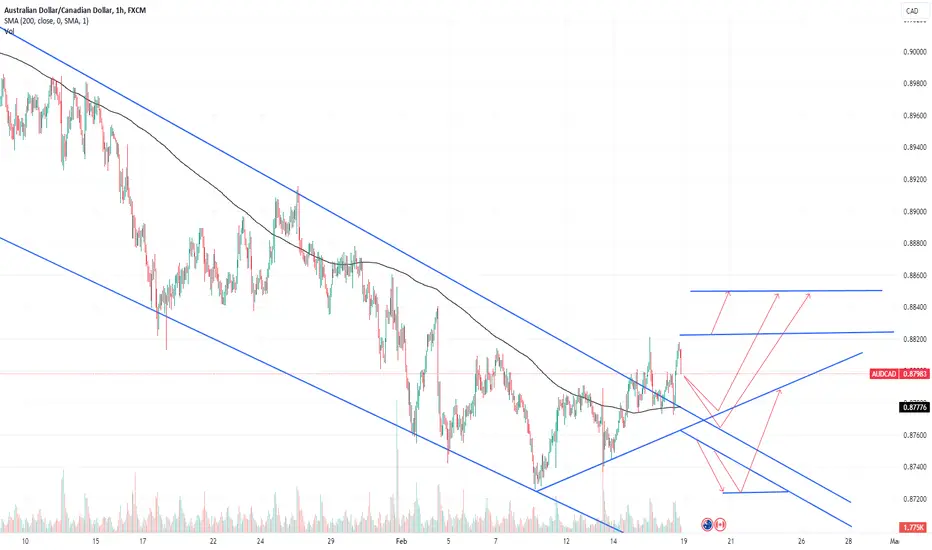
Two area that I think are suitable for a sell position. I risk 0.5% in the first position (red line) and 0.5% in the second position (blue line).
RR: 3
Good Luck.

AUDCAD - Channel Breakout or ReversionAUDCAD is exhibiting signs of breaking out of its recent Bearish channel.
It is encountering resistance at the 4hr 100 SMA (0.88)
It will possibly test the previous upper channel trend line to see if it is provides support or falls below it re-entering the channel to revert to the lower trendline.
Upcoming news for both currencies will likely initiate any directional move if hasn't occurred prior.
AUDCAD H4 | Heading into resistanceAUD/CAD is rising towards a pullback resistance and could potentially reverse off this level to drop lower.
Sell entry is at 0.88265 which is a pullback resistance that aligns with the 61.8% Fibonacci projection level.
Stop loss is at 0.88680 which is a level that sits above the100.0% Fibonacci projection level.
Take profit is at 0.87745 which is a pullback support.
High Risk Investment Warning
Trading Forex/CFDs on margin carries a high level of risk and may not be suitable for all investors. Leverage can work against you.
Stratos Markets Limited (www.fxcm.com):
CFDs are complex instruments and come with a high risk of losing money rapidly due to leverage. 66% of retail investor accounts lose money when trading CFDs with this provider. You should consider whether you understand how CFDs work and whether you can afford to take the high risk of losing your money.
Stratos Europe Ltd, previously FXCM EU Ltd (www.fxcm.com):
CFDs are complex instruments and come with a high risk of losing money rapidly due to leverage. 70% of retail investor accounts lose money when trading CFDs with this provider. You should consider whether you understand how CFDs work and whether you can afford to take the high risk of losing your money.
Stratos Trading Pty. Limited (www.fxcm.com):
Trading FX/CFDs carries significant risks. FXCM AU (AFSL 309763), please read the Financial Services Guide, Product Disclosure Statement, Target Market Determination and Terms of Business at www.fxcm.com
Stratos Global LLC (www.fxcm.com):
Losses can exceed deposits.
Please be advised that the information presented on TradingView is provided to FXCM (‘Company’, ‘we’) by a third-party provider (‘TFA Global Pte Ltd’). Please be reminded that you are solely responsible for the trading decisions on your account. There is a very high degree of risk involved in trading. Any information and/or content is intended entirely for research, educational and informational purposes only and does not constitute investment or consultation advice or investment strategy. The information is not tailored to the investment needs of any specific person and therefore does not involve a consideration of any of the investment objectives, financial situation or needs of any viewer that may receive it. Kindly also note that past performance is not a reliable indicator of future results. Actual results may differ materially from those anticipated in forward-looking or past performance statements. We assume no liability as to the accuracy or completeness of any of the information and/or content provided herein and the Company cannot be held responsible for any omission, mistake nor for any loss or damage including without limitation to any loss of profit which may arise from reliance on any information supplied by TFA Global Pte Ltd.
The speaker(s) is neither an employee, agent nor representative of FXCM and is therefore acting independently. The opinions given are their own, constitute general market commentary, and do not constitute the opinion or advice of FXCM or any form of personal or investment advice. FXCM neither endorses nor guarantees offerings of third-party speakers, nor is FXCM responsible for the content, veracity or opinions of third-party speakers, presenters or participants.

AUDCAD Possible Long Position H1 - ReEntry
M15 - CSM ((when candle close outside the Top/Below BB ))/Candle Close Above 50 EMA
M5- wait for Reentry in MALO
Note:
* 1:3 RRR (10 sl, 30 tp)
*TAYOR

AUDCAD - Short active Hello traders!
‼️ This is my perspective on AUDCAD.
Technical analysis: Here we are in a bearish market structure from 4H timeframe perspective, so I am looking for short. I expect bearish price action from here as price took trendline liquidity and rejected from bearish order block + FIBO 0.786 level.
Like, comment and subscribe to be in touch with my content!

shortThis Is An Educational + Analytic Content That Will show entry ideas for trades.
Make Sure You Watch The Price Action Closely In Each Analysis As This Is A Very Important Part Of Our Method
Disclaimer : This Analysis Can Change At Anytime Without Notice And It Is Only For educational Purpose to Traders To Make Independent Investments Decisions.
Disclaimer
The information and publications are not meant to be, and do not constitute, financial, investment, trading, or other types of advice or recommendations supplied or endorsed by TradingView

AUDCADToday's analysis of the Canadian dollar against the Australian dollar. There is still a buying crowd on the Australian dollar

AUDCAD I Potential intraday short from top of the channel Welcome back! Let me know your thoughts in the comments!
** AUDCAD Analysis - Listen to video!
We recommend that you keep this pair on your watchlist and enter when the entry criteria of your strategy is met.
Please support this idea with a LIKE and COMMENT if you find it useful and Click "Follow" on our profile if you'd like these trade ideas delivered straight to your email in the future.
Thanks for your continued support!

AUDCAD Weekly M formationAUDCAD Weekly M formation
On the Weekly we have a M formation so our target.
On the Daily, we just broke daily struction so we started bullish momentom
on the 4h too
3 time frame in sync

AUDCAD - Resistance Becomes Support 📈Hello Traders !
The AUDCAD Broke The Daily Resistance Level (0.88146 - 0.88014).
This Resistance Level Becomes a New Support Level.
The Resistance Line is Broken.
So, I Predict a Bullish Move 📈
------------
TARGET: 0.88610🎯

AUDCAD SHORTThis is just simple trading idea draw into chart using labels and lines. Please use it as educational purpose and you are free to modify any

AUDCADIn the AUD/CAD pair's daily timeframe, a bullish trend seems to be emerging. After completing a 61% correction following a breakout from a falling wedge pattern, the Elliott wave theory suggests a potential ABC pattern forming. This sequence typically indicates a continuation of the previous trend, signaling a possible upward movement in the pair's price action. Traders may look for confirmation signals to validate this bullish outlook before considering entry positions.

AUDCAD Long setupI see a nice long setup on AUDCAD. Mid-term trend is changing and i expect a long till resistance zone at 0.89100


AUDCAD Technical Analysis! SELL!
My dear followers,
This is my opinion on the AUDCAD next move:
The asset is approaching an important pivot point 0.8814
Bias - Bearish
Safe Stop Loss - 0.8832
Technical Indicators: Supper Trend generates a clear short signal while Pivot Point HL is currently determining the overall Bearish trend of the market.
Goal - 0.8781
About Used Indicators:
For more efficient signals, super-trend is used in combination with other indicators like Pivot Points.
———————————
WISH YOU ALL LUCK

AUDCADlooking to SELL, GOOD RATIO, ill be monitoring the behavior and delivery into my area of interest
AGAIN ILL BE MONITORING BEHAVIOR BEFORE MAKING ANY DECISIONS
Plus this is an areas of interest once price get there that's when I start looking for Any of my entry models to take place on the lower timeframes while taking into the account the TIME to PRICE relationship
NB: REMEMBER THE 4 MARKETS COMPENENTS
TIME
OPEN INTERST
VOLUMN
PRICE
