AUDCAD trade idea
AUD/CAD moving quickly from equilibrium showing the bullish price.
note - we aud cpi on 24/4/2024
AUDCAX trade ideas

Final Video Regarding the Australian CPI This is video number 3 of 3. Watch the last two in the links below to gain insights on how I trade economic reports such as the Australian CPI
That's it - That's all
Trade Safe

AUDCAD Bullish Trade ideaAudcad has recently sweep the sell side liquidity, as we can see that on 4H TF it respecting the supply zone. the price is in the discount zone

AUDCAD likely to move upwardsAUDCAD is in an uptrend in the 4-hour timeframe and seems to be following a rising channel. In the short-term, it was in a downtrend in the 1-hour timeframe, where it was respecting a downward trendline. The price was unable to break the lower line of the channel and formed a very strong hammer candle. It went ahead and broke out of the downward trendline.
I see high chances of the price moving upwards.

AUD CAD PRICE WILL BE DOWN FALL TILL MARKED PRICE LINE AUD CAD PRICE WILL BE DOWN FALL TILL MARKED PRICE LINE make a short entry as shown in the picture follow for more live updates...

A Classic Support & Resistance TradeI'd engaged in a classic Support and resistance trade with 1 single target and observed candlestick movement on a key turning point.
Shorted AUDCAD at 0.8845 and my Initial Stop-Loss is at 0.8864(-19pips)(~190usd/lot).
Once the market hit 0.8829, I would shift stop to entry(SLE), attaining a risk-free trade.
In between I do nothing!

AUDCAD - BEARISH CONTINUATIONPrice could possibly break back above to fill the range.
Looking for a break and close above the resistance level at 0.88495, then waiting for a minor pullback to retest the level before placing a buy order to fill the range.
Ideally I would prefer to see price continue to the downside with a break and close below the 0.88220 level, as current trend is bearish.
Again for sells I am looking for a break and retest before entering a position.
Targeting 0.87825 level where I will look to close 50% and move my stops to BE, with a full TP target at 0.87555.

AUDCAD: Breakout & Bearish ContinuationAUDCAD successfully surpassed and closed below an important intraday horizontal support last week.
Following this breakout, the market retraced back to retest the previously broken level.
The bearish response to this retest suggests that there is a strong likelihood for the downtrend to persist.
The targets for this decline are set at 0.8800 and 0.8760.

AUDCAD LONGThis is just simple trading idea draw into chart using labels and lines. Please use it as educational purpose and you are free to modify any

AUD CAD PRICE - DOWN FALL TO SUPPORT ZONE TO FILL LIQUIDITYAUD CAD PRICE - DOWN FALL TO SUPPORT ZONE TO FILL LIQUIDITY, here we can see that price formed consolidation got a breakout to support zone after that price formed a uptrend line, need to wait for a breakout of up trend line, if the break out happpen make a short entry to support zone as shown in the picture, follow for more live updates...

🔍📊 "Analysis of AUDCAD: Market Insights and Strategies" 💡📉🕵️♂️ Let's dive into analyzing the Australian Dollar against the Canadian Dollar and see how they compare to each other. We'll focus on lower timeframes for this analysis.
📅 As we start the first day of the week, the market has just opened, and traders are awaiting the American session for their trading activities. Typically, we see increased volume during this time as traders enter the market.
🔄 On higher timeframes, this currency pair mostly trades within a range, with traders engaging in range trading and oscillations within this range. Therefore, our strategy and trends are more range-bound in higher timeframes.
🕓 On the four-hour timeframe, after hitting the daily resistance at 0.89963, we are currently experiencing a downward movement towards the bottom of the range. Currently, we are resting on a significant support level at 0.88135, waiting for new price action.
📉 For a short position, our support is identified, and after the breach of the 0.88135 support level and confirmation with a candle below this support, we consider it broken. We can then hold our short position with a target of 0.87326, provided this support is decisively broken.
📈 For a long position, considering the range-bound nature of higher timeframes, we can anticipate a trend reversal sooner and capture it. We can open our long position after the break of the descending trendline and confirmation of the 4-hour trigger at 0.88484.
🔍 Our upcoming supports are at 0.87792, 0.87326, and 0.865, while our resistances after the trendline breach are at 0.88951, 0.89495, and 0.8996.
📊 I recommend observing the market on Tuesday and exercising patience before initiating trades. Tuesday might not always be the most profitable trading day, but it's crucial to stay disciplined and wait for favorable trading conditions. This advice is based on my personal experience and trading journal analysis and may vary for different traders.
😊 If you'd like me to analyze a specific coin or currency pair, be sure to comment so that I can allocate the next analysis for you!
⚠️ Also, please remember that I'm just an analyst, and this isn't financial advice. We're here to stay in the market and maximize profits by adhering to risk and capital management principles.

Idea on a chartWe have a great trade looking at the FVG on this time frame. We can see a great set up with nice fib levels.

AUDCAD Long Trade Setup A #long trade opportunity recently presented itself on the #aussieloonie (#AUDCAD) #trading chart 📈.
This is indicated by the #bullish engulfing candlestick 🕯️ pattern just above the 0.88046 horizontal support level.
This indicates a rejection of the same level, with potential price move in the upward ⬆️ direction (#buy).
Sufficient upward momentum should see price rallying towards the 0.90000 psychological level and possibly testing the strength of the 0.90113 horizontal resistance level.
As always, please apply appropriate risk management.
Happy trading!
#crosspair

AUDCAD Looks good for a buy to sell set up I'm going to wait to see if we get a push higher and then wait for the retracement for a buy to the big sell off area

AUDCADAUDCAD is in a Bearish Channel.
D1 is an Engulfing Candle which means sellers are in power
Bearish Channel/Flag in 1H

Rising into 38.2% Fibo resistance, could it reverse from here?AUDCAD is rising towards a resistance level which is a pullback resistance that aligns with the 38.2% Fibonacci retracement. A reversal from this level could lead the price to drop to our take profit.
Entry: 0.88469
Why we like it:
There is a pullback resistance level which aligns with the 38.2% Fibonacci retracement.
Stop loss: 0.88948
Why we like it:
There is an overlap resistance level which aligns with the 61.8% Fibonacci retracement.
Take profit: 0.87811
Why we like it:
There is a pullback support level
Please be advised that the information presented on TradingView is provided to Vantage (‘Vantage Global Limited’, ‘we’) by a third-party provider (‘Everest Fortune Group’). Please be reminded that you are solely responsible for the trading decisions on your account. There is a very high degree of risk involved in trading. Any information and/or content is intended entirely for research, educational and informational purposes only and does not constitute investment or consultation advice or investment strategy. The information is not tailored to the investment needs of any specific person and therefore does not involve a consideration of any of the investment objectives, financial situation or needs of any viewer that may receive it. Kindly also note that past performance is not a reliable indicator of future results. Actual results may differ materially from those anticipated in forward-looking or past performance statements. We assume no liability as to the accuracy or completeness of any of the information and/or content provided herein and the Company cannot be held responsible for any omission, mistake nor for any loss or damage including without limitation to any loss of profit which may arise from reliance on any information supplied by Everest Fortune Group.

AUDCAD Current Market Outlook | Analyzing Trends and ForecastingWelcome to our latest analysis of the AUDCAD currency pair! In this video, we delve into the current market conditions, dissecting key trends and providing insights to help you navigate the dynamic forex landscape.
Join us as we analyze recent price action, identifying critical support and resistance levels that are shaping the AUDCAD's trajectory. From fundamental drivers such as economic indicators and central bank policies to technical analysis tools like trendlines and oscillators, we leave no stone unturned in our quest to provide you with a comprehensive market outlook.
Whether you're a seasoned trader or new to forex, this video offers valuable insights into the AUDCAD market. Stay ahead of the curve with our expert analysis and stay tuned till the end for actionable strategies on how to capitalize on potential market opportunities.
Don't miss out on this essential guide to the AUDCAD market – hit the play button now and empower yourself with the knowledge needed to succeed in forex trading. Be sure to like, share, and subscribe for more updates on currency pairs and financial markets!

SELL INSTAND The AUDCAD is now in a bearish trend and continues its ride there is no divergence on an rsi indicator and above LH is your sl and make sure you can calculate your risk before entering the trade.

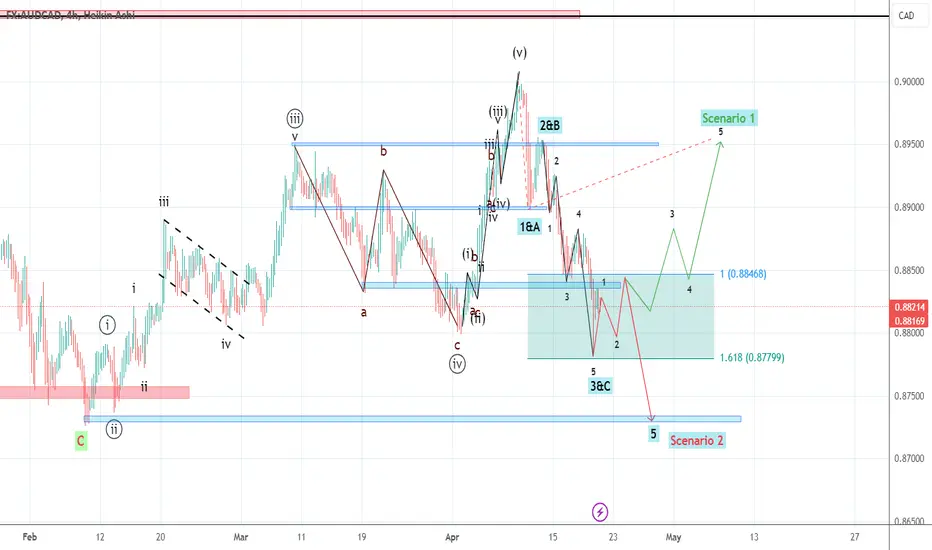
AUDCAD (Elliott wave)Hello friends
In the AUDCAD currency pair, we observed a complete 5 wave.
After these 5 waves, we expected a correction, mostly a zigzag or...
Wave 1 or A, 2 or B and 3 or C have happened.
Right now we have a single uptrend.
For this situation, 2 scenarios can be imagined.
The first scenario, which is more likely, is the end of wave 3 and the beginning of an uptrend.
But the second scenario, which is weaker, can complete its own 5th wave in the majority of a 5-wave and should be counted again.
I am waiting for the price correction to finish and price growth seems more likely.
The first goal of the climb for the first scenario is the range of 0.8950 and the goal of the second scenario is 0.8730
To support me, I recommend that you install Trading View software on your phone and see my analysis and support me with your comments and Boost. Be successful and profitable.
What is AUDCADs next move? ,2hrAUDCAD is currently ranging in an uptrend. It has reached our support zone in the trend. As we always look for buying opportunities in a an uptrend hopefully its next move will up.
AUDCAD has reached strong demand zone inside the trend which it might respect and push upwards and push to the 0.90050 zone.
But failer to do so will result in it selling after the breakout and retest of the uptrend.

AUDCAD Is the bear ready?I posted this idea a while back...
Lets see if all 3 targets are going to hit like last time...

AUDCAD long to sell or long to sell of? Will be watching this one closely next week, must check the news calendar

AUDCAD Trade Alert - Bearish Setup at Key Support Breakout.Bearish Trendline at 4-Hour Time Frame:
AUDCAD has been following a bearish trendline in the 4-hour time frame, indicating a prevailing downward momentum in the market.
Observation of Dow Theory:
Additionally, the market has been adhering to the principles of Dow Theory, reinforcing the bearish sentiment.
Retracement and Rejection:
A retracement up to the 0.5 Fibonacci level was observed, followed by a clear downward rejection, suggesting strong selling pressure at higher levels.
Current Position at Key Support Zone:
Presently, the price is hovering around a critical support zone, signifying a pivotal area where significant price action is anticipated.
Trade Setup:
We anticipate a continuation of the bearish move if the price breaks below this key support level.
Entry Strategy:
A prudent entry point for short positions is identified near 0.88863, aligning with the bearish outlook.
Risk Management:
To mitigate potential losses, a Stop Loss is recommended near 0.89279, providing a buffer against adverse price movements.
Profit Targets:
Our profit-taking strategy involves targeting TP-1 at 0.8450 and TP-2 at 0.88030, reflecting our expectation of downward price movement.
Conclusion:
In conclusion, based on the technical analysis of AUDCAD, we anticipate further downside potential, with a well-defined entry point, risk management, and profit-taking levels in place to optimize trading outcomes.
