AUDUSD-Bearish Butterfly patternThe pair is making Bearish Butterfly harmonic pattern have to wait for price to enter PRZ to see if possibility of short entry exist.
AUDUSD trade ideas

A must-see answer to invest AUDUSDHello friends nice to meet you all hope you have a good time and have a great investment time.
As you see the blue line, RSI berish divergence was appeared.
It can have a rebound at a meaningful recent point and the final goal is the tail's zone below.

AUDUSD: Structure AnalysisFrom our previous analysis, the market was in a critical moment and after it moved above
0.6450 it didn't stop until now.
Currently, AUDUSD is facing another strong resistance zone located near 0.6640.
The price was rejected near to this area several times on the past by adding more valut the to strength of this structure.
We have to look at for possible reversal signs if we want to trade on the "ShORT" side
We have to wait for the price to bounce above 0.6640 for a bullish wave. If this breakout happens we may see AUDUSD rising further up to 0.6840.
You may find more details in the chart!
Thank you and Good Luck!
❤️PS: Please support with a like or comment if you find this analysis useful for your trading day❤️
Previous Analysis:

AUD/USD LOOKING TO TAKE THE MARKET LONGAUD/USD 4H - This is one of the only markets I have analysed this weekend that I feel will trade us higher with it having the USD as the quote currency, this obviously causes some discrepancies however the analysis I have completed suggests this move.
I want to see price trade us back down now to set a higher low after giving us a break of structure on the 4H timeframes, the break of structure suggests there is more Demand in the market than there is Supply meaning we should see the introduction of bullishness now.
Especially with price trading us down and into the Demand Zone below and clearing that area in price. Once price trades us down and into an area of Demand I have marked out fractally from the last impulse that broke the structure we need to wait for further confirmation.
We want to see price break structure again fractally once it trades into an area of Demand, this giving us the confirmation that price finished its corrective wave and is ready for the next move higher.

🆕 AUDUSD: Curve Analysis 🆕(Based on the 1D Chart)
SLO2 @ 0.6841 ⏳
SLO1 @ 0.6781 ⏳
TP4 @ 0.6751
TP3 @ 0.6642💰
TP2 @ 0.6571💰
TP1 @ 0.6469💰
BLO1 @ 0.6364 📈
BLO2 @ 0.6301 ⏳
This is an Intermediate Time Frame trade (4 hours to 6 day):
— Offers a clearer picture of the underlying trend compared to short-term frames.
— Provides more opportunities for confirmation signals and technical analysis.
— Allows for more flexible trading schedules, trades can be held overnight.
— Suitable for swing traders and some positional traders.

What most people don't realize isthat the market is rigged. Not by nefarious actors bent on dominating the world, but by the humanity all participants naturally possess. We are a group of people who trade variety of assets, and we cannot avoid the implications of the group component. There is a large measure of mass psychological force that influences the way prices move and levels to which they gravitate and avoid, but sometimes, especially when the market is confused or aimless, these influences of mass psychology can be suppressed or understated due to the fact that the market produces winners and losers, or that assets are difficult to value and status quo is more readily accepted. When a market gets out of sync, we experience volatility as it corrects. The dissonance between expectations and reality are felt by all participants, eventually.
I have had occasion over the past month to trade with a fine gentleman goes by @KEV911, and he has honestly brought me back to reality and vitality in my own market. Our strategies and risk appetites are rather similar, but our technical approaches span the gambit between us, with very little overlap. Kevin had asked me about my thoughts on DXY, the primary asset I track, and had asked me to look at AUD, an asset with which I was unfamiliar. After about an hour and a half of initial review, I said...I think after reaching toward 66, it will need to trade below 62, as low as 59, depending on how long it takes to get to those levels, prior to to a move up to the next level of 67-68. A week or two later, I lined the entire chart, back to 1971, and my conviction grew, that a large devaluation of the asset was necessary to get market corrected and back on a normal pattern. Kevin eventually endorsed my review stating that what amazed him is that although we do not attempt to predict price with the same tools, we had both come to the same conclusion. He revealed he had been talking 62-61 for months, and I had only recently discovered the asset.
As we continue to trade in close proximity, he in forex, I in equities, I have taken an interest in the Aussie dollar, because it appears extremely bullish while its price is relatively demure, in more of a neutral zone. Moreover, PRICE MUST TRADE TO A PARTICULAR TREND LINE ON THE CHART, as far as I am concerned, AND THE SOONER THE BETTER, because the longer it takes, the lower it will need to go to reach the necessary zone and trend line. I do not worry whether this will eventually happen, I have no doubt, it will, but I cannot help but wonder why sometimes it takes so long for price to satisfy its destiny. Some answers may be, not everyone trades on technicals, and less trade on Elliot Wave theories. People are stubborn, and ultimately ignorant of the true value of the assets they trade. Other market forces, like desires to maintain wholly separate asset prices can depend on certain levels being maintained in AUD, for example. I do not know the answer, but what I do know, is that someone will be hurt financially when the necessary move happens, and not because losing on a trad always must be harmful to the losing trader, but because of the extent to which the market is out of balance. A move from nearly 66 to sub 60 in this asset, as I understand, could be a matter of nearly 200,000 even for an average risk position. Moreover, the next move should be quite strong, and quick, with little available exit point.
But, hey, we are all free people, and that is what makes the fun. I hope the maintenance of this price level is worth it to whomever holds it, and I mean that.
Best to ALL,
Cuz
AUDUSD - LongHello Traders,
After last week FED meeting we might see some weaknesa in the usd as Jerome Powell mentioned rate cuts.
I also expect more risk on sentiment with AUD strength and upside for indices.
Comment if you have any questions regarding the trade.
Have a great week! :)

check the trend It is expected to stabilize after some fluctuation above the support area, and then the start of the upward trend is likely, if the price crosses the support area, the continuation of the downward trend is possible

audusd sell signal . Don't forget about stop-loss.
Write in the comments all your questions and instruments analysis of which you want to see.
Friends, push the like button, write a comment, and share with your mates - that would be the best THANK YOU.
P.S. I personally will open entry if the price will show it according to my strategy.
Always make your analysis before a trade

AUDUSD MAY 2024 WEEK 2 OUTLOOK -
Daily - bullish. I mentioned when AUD CPI came out that the structure and numbers all were almost identical to what happened in October 2023 and after that in November AUDUSD bias flipped to bullish. so far, that hypothesis has held. Although I won't mind going long AU today, I would like the price to pullback a little.
Origin - bullish - origin in sync with daily. price can move up from here too but ideally I will have more confidence in longs if price pulled back and got absorbed from the zone - **0.65941 - 0.65536** we have AUD cash rate news on tuesday, so this pullback might happen tomorrow.

AUDUSD
After a significant 80+ pips downward movement post-choch, AUDUSD seems to be adhering to Elliott Wave principles, completing its 3rd wave. As it enters the 4th wave, a 50% retracement is completed, coinciding with a touch on the ascending trendline. With buying block orders activated, AUDUSD is likely to shift towards a bullish trajectory.

AUDUSD: Australian budget revenue growth cools amid economic heaThe Treasurer has previously highlighted the impact of weaker commodity prices, particularly on iron ore - a key Australian export - along with rising unemployment as key factors. to adjust revenue. Australia's unemployment rate hit a two-year high of 4.1% in January.
Over the last month, Chalmers has also highlighted concerns about global economic stability, noting that recent events in the Middle East are likely to affect upcoming budget plans in May. The exchange rate at the time of announcement was $1 to 1.5133 Australian dollars.

AU to Dec. 2023 Levels?!Here I have AUD/USD on the Daily Chart!
Since the Low in April, Price for AU has been on a Bullish Run!
I believe the Resistance Level it has been struggling with all year may be coming to BREAK soon!!
On the tail of LOWER than expected NFP numbers for USD last week AND word that the RBA may be needing to look to INCREASE INTEREST RATES .. We could see MUCH more bullishness from AU
SO much in fact that I think the Highs of Dec. 2023 may be in sights!
I am currently waiting for:
Price to fall Lower to a Minor Level of Support to enter a Buy Position
-OR-
Price to Break the Resistance Zone @ ( .6640 - .6612 ) and then to Retest Break for Buy Position

Aussie H4 | Resistance overheadThe Aussie (AUD/USD) could rise towards a multi-swing-high resistance and potentially reverse off this level to drop lower.
Sell entry is at 0.6644 which is a multi-swing-high resistance.
Stop loss is at 0.6678 which is a level that sits above the 161.8% Fibonacci extension level and a swing-high resistance.
Take profit is at 0.6575 which is a pullback support.
High Risk Investment Warning
Trading Forex/CFDs on margin carries a high level of risk and may not be suitable for all investors. Leverage can work against you.
Stratos Markets Limited (www.fxcm.com):
CFDs are complex instruments and come with a high risk of losing money rapidly due to leverage. 68% of retail investor accounts lose money when trading CFDs with this provider. You should consider whether you understand how CFDs work and whether you can afford to take the high risk of losing your money.
Stratos Europe Ltd, previously FXCM EU Ltd (www.fxcm.com):
CFDs are complex instruments and come with a high risk of losing money rapidly due to leverage. 70% of retail investor accounts lose money when trading CFDs with this provider. You should consider whether you understand how CFDs work and whether you can afford to take the high risk of losing your money.
Stratos Trading Pty. Limited (www.fxcm.com):
Trading FX/CFDs carries significant risks. FXCM AU (AFSL 309763), please read the Financial Services Guide, Product Disclosure Statement, Target Market Determination and Terms of Business at www.fxcm.com
Stratos Global LLC (www.fxcm.com):
Losses can exceed deposits.
Please be advised that the information presented on TradingView is provided to FXCM (‘Company’, ‘we’) by a third-party provider (‘TFA Global Pte Ltd’). Please be reminded that you are solely responsible for the trading decisions on your account. There is a very high degree of risk involved in trading. Any information and/or content is intended entirely for research, educational and informational purposes only and does not constitute investment or consultation advice or investment strategy. The information is not tailored to the investment needs of any specific person and therefore does not involve a consideration of any of the investment objectives, financial situation or needs of any viewer that may receive it. Kindly also note that past performance is not a reliable indicator of future results. Actual results may differ materially from those anticipated in forward-looking or past performance statements. We assume no liability as to the accuracy or completeness of any of the information and/or content provided herein and the Company cannot be held responsible for any omission, mistake nor for any loss or damage including without limitation to any loss of profit which may arise from reliance on any information supplied by TFA Global Pte Ltd.
The speaker(s) is neither an employee, agent nor representative of FXCM and is therefore acting independently. The opinions given are their own, constitute general market commentary, and do not constitute the opinion or advice of FXCM or any form of personal or investment advice. FXCM neither endorses nor guarantees offerings of third party speakers, nor is FXCM responsible for the content, veracity or opinions of third-party speakers, presenters or participants.

AUDUSD Trading IdeaBased on Simple Technical Analysis ( Trendline + Support & Resistance )
Risk Disclaimer:
Please be advised that I am not telling anyone how to spend or invest their money. Take all of my analysis as my own opinion, as entertainment, and at your own risk. I assume no responsibility or liability for any errors or omissions in the content of this page, and they are for educational purposes only. Any action you take on the information in these analysis is strictly at your own risk. There is a very high degree of risk involved in trading. Past results are not indicative of future returns. Good luck :-)

AUDUSD on the downsideThe price is moving in a downward direction to establish a possible pattern. This pattern is only drawn for a schematic view and it may move down in a different direction. Money management is mandatory.

AUDUSD Forecast: Balancing Economic Realities with Market ExpectIn anticipation of the forthcoming FOMC meeting, the AUDUSD currency pair is demonstrating a notable increase in value, defying the backdrop of data indicating a prevailing contraction in private business activity across Australia during March. Despite these domestic economic challenges, market attention remains focused on the Reserve Bank of Australia’s (RBA) upcoming meeting scheduled for the following week, widely expected to maintain interest rates at their current level of 4.35%.
Against this backdrop, analysts and traders are closely monitoring the unfolding dynamics surrounding the FOMC meeting today. There is a prevailing sentiment within the trading community anticipating a potential bullish impulse in the market. Specifically, there are expectations that the price of the AUDUSD pair may experience a rebound from the significant Fibonacci retracement levels of 50% to 61.8%. Furthermore, there's speculation that this upward movement could bring the price back around the FVG area, signifying a possible uptrend in the market. This anticipated price action suggests the potential for a definitive pullback in the price, presenting traders with opportunities for strategic positioning and profit-taking.

Expectation on AUDUSD (6/5/24 - 10/5/24)5/5/24 - We can see AUD has came up to the previous sell off price and price failed to continue above but closed below follow up with another negative candle. I expect this to be Phase 2 high by AUD and right now it may try to find its support to complete Phase 2 before continue to offer out creating Phase 3.
I'll be monitoring the development of candles at 1700 and 2100 (GMT+8) to understand if AUD is planning to do Phase 3.
All the best traders. - Nav

sell 4hr4hr resistance area... So Sell SL maintain. Support resistance bass trading plan. Happy Trading. Thank you.

Short trade
Tuesday, April 30th, 2024
New York Session
5:00 PM
Entry: 0.64682
Profit level: 0.63940 (1.15%)
Stop level: 0.64966 (0.44%)

AudUSD buyMy focus pm this buy comes from oil being oversold and creating a head and shoulders on the higher time frame although selling is the overall outlook buying will be most profitable after seller liquidly is grabbed this is my position I'm looking to take FOREXCOM:AUDUSD FOREXCOM:USOIL

AUDUSDHere is my analysis for AUDUSD 04/05/2024
This is what happened prior & what I think is going to happen next.
My predictions are shown in this shot.

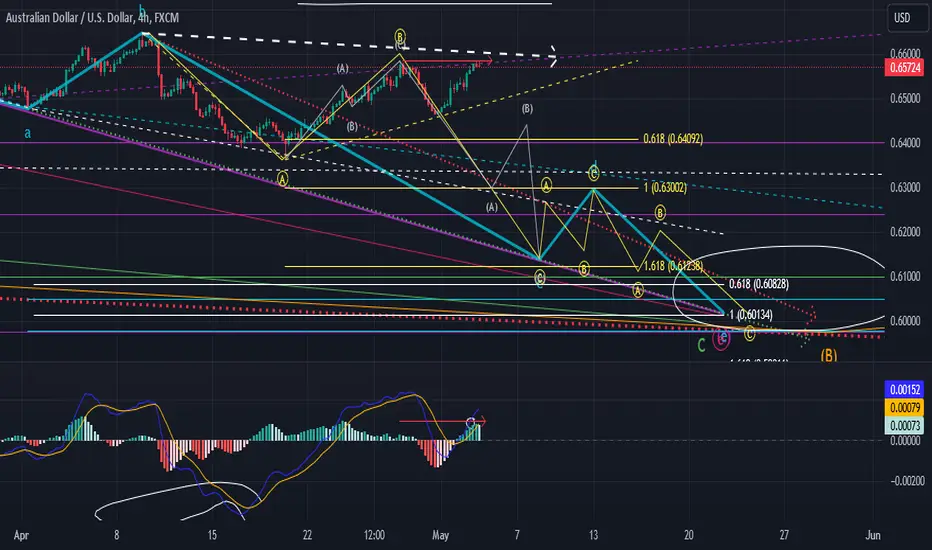
short then longi think it will go to the .62 fib zone before returning up. i went off of wykoff theory and a bit of elliot wave. i could be wrong. if anyone has insight on where i went wrong please contact me so i can better understand.
