short on audusd in search of balanced priced before the us cpii’d like to watch how the price will act after the rbnz rate decision and just before the us cpi release
AUDUSD trade ideas


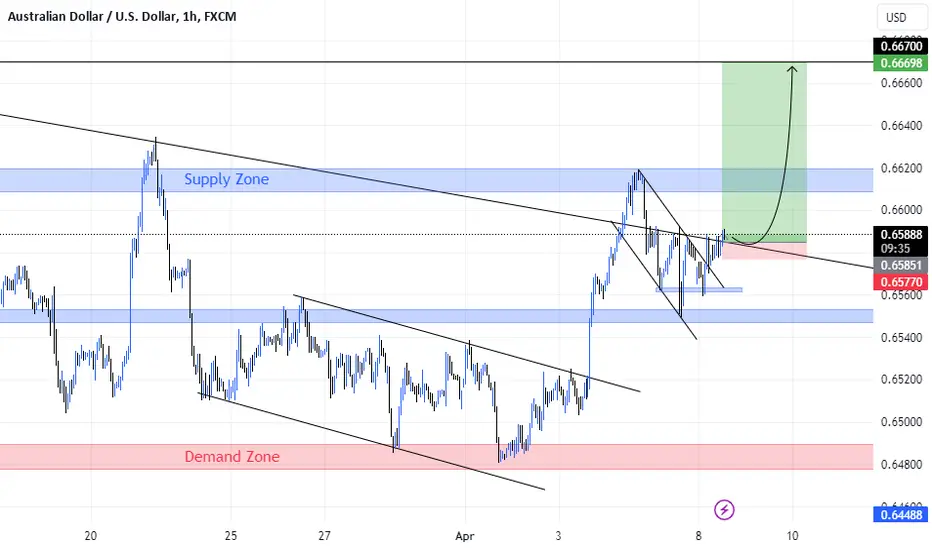
AUDUSD → Test resistance for an upward breakout FX:AUDUSD forms a retest of the descending channel resistance, but there is no fall. Against the background of the dollar correction, the currency pair may move into the realization phase after the channel breakout.
Moving averages, trend resistance and pre-breakout consolidation, with strong support zones, to which a large buyer does not let the price go. An interesting setup in the current conditions may form an attempt to change the trend. The key area is 0.6585. Consolidation of the price above this boundary may allow to overcome the obstacle and finally let the price strengthen to 0.66676, or to 0.67287.
Resistance levels: 0.6585, 0.6620
Support levels: 0.6551, 0.6504
Technically, there is a strong accumulation and prerequisites for a breakout. The resistance breakout will confirm the activation of the realization phase, which will give us a good bullish momentum.
Regards R. Linda!

AUDUSD BEARISHPotential SELL AT MARKET EXECUTION OR SELL STOP AT 0.67100 OR HIGHER
SL: 0.67500 OR HIGHER (40 pips or more)
TP 1: 0.66700 (40 pips) 1:1RR
TP 2: 0.66300 (80 pips) 1:2RR
- Candles crossing below 200 EMA and the structure has been broken on the downside. Bearish condition met.
- MOM facing down. Bearish condition met.
- STOCH facing down and below 0. Bearish conditions met.
Result:
Pending
Please Do Your Own Analysis And Use Proper Risk Management. Only Take This Trade If It Makes Sense To You

AUDUSD TP 2 HIT! +80 PIPSPotential SELL AT MARKET EXECUTION OR SELL STOP AT 0.67100 OR HIGHER
SL: 0.67500 OR HIGHER (40 pips or more)
TP 1: 0.66700 (40 pips) 1:1RR
TP 2: 0.66300 (80 pips) 1:2RR
- Candles crossing below 200 EMA and the structure has been broken on the downside. Bearish condition met.
- MOM facing down. Bearish condition met.
- STOCH facing down and below 0. Bearish conditions met.
Result:
ALL TPs HIT

AUDUSD BEARISHAUDUSD is looking like it will continue to sell.
It is already below the 200 EMA and has just broken structure on the downside by crossing below the 50 EMA.
- MOM looks like it is on the 0 line but it is actually negative which for me is a bearish confirmation.
-STOCH is below 50, facing down and the orange line is above the blue. These are also bearish confirmations for me.
Potential sell at Market Execution or Sell limit at 0.67150.
SL: 0.67550 (-40 PIPS)
TP 1: 0.66750 (+40 PIPS)
TP 2: 0.66550 (+60 PIPS)
TP: 0.66350 (+80 PIPS)

AU BEARISH Hey Rich Friends,
I think AU will continue to sell. Potential Market Execution or Sell Limit.
-The market has continued to reject this area 3 times.
- The MOM is facing down. I am waiting for it to cross below 0.
- The STOCH is facing down, below 50 and the orange line is above the blue line.
I stick to simple indicators and confirmations with this strategy.
50 EMA
200 EMA
MOM
STOCH
- Peace and Profits, Cha

AU BULLISHHey Rich Friends,
It looks like AU will continue to buy. Here is what I am looking at:
- The candles are above the 200 EMA and have crossed above the 50 EMA
- The MOM is facing up and above 0.
- The STOCH is facing up and the blue line is above the orange line. I am waiting for it to cross above 50.
I am looking to buy at Market Execution or set a buy limit at 0.64550. I have set a 1:2RR. SL: 0.64300, TP 1 AT 0.65050.
- Peace and Profits, Cha

Why I think AU Will Continue to Sell Hey Rich Friends,
I think AU will continue to sell. Here is what I am looking at.
The market has already tapped into the supply zone. It may retest around 0.64450 or higher.
- Candles have crossed below the 50 EMA.
- MOM is below 0
- STOCH is facing down, the orange line is above the blue line but the lines have not crossed below 50.
Waiting for these things to enter:
- STOCH to cross below 50
- Candles to close below 200 EMA
I have a market execution order and a sell limit in the supply zone. 40 pip SL and 40 pip TP.
- Peace and Profits, Cha

Why I Think AUDUSD Will Continue to Sell Hey Rich Friends,
I think AU will continue to sell after retesting the supply zone (0.63340 - 0.63550). I have set a pending order called a Sell Limit.
Here is what I am looking at:
- Resistance in the supply area
- Candles are below both EMAs
- MOM is below 0 and negative
- STOCH is below 50, orange is over the blue
Please check the news and be mindful of the AUD and USD news coming out this week!
- Peace and Profits, Cha

Do I Think AUDUSD Will Continue to Sell Today? YesHey Rich Friends,
I think that AU will continue to sell today, this is what I am looking at. However, REMEMBER TO CHECK THE NEWS AND YOUR CHARTS BECAUSE IT IS NFP WEEK.
- Previous resistance in the supply zone
- Break of structure on the downside from the previous candle
- MOM is facing down but not yet below 0. You can wait for it to cross below 0 for added confirmation.
- STOCH is facing down, crossed below 80, and the orange line above the blue line. You can wait for it to cross below 50 for added confirmation.
- Candles are still above both EMAs so use caution here
You can do market execution or set a pending sell limit or sell stop to maximize your results in this potential trade idea. You can also use a previous high as a SL for a selling trade and a previous low as a TP.
Good luck!
- Peace and Profits, Cha

LOOKING TO GO SHORT ON AUD/USDAUD/USD 15M - As you can see I am looking to take this market short after we have recently had price penetrate and trade us into an area of Supply, we have had price break structure fractally suggesting the potential for a down move.
In order for us to have the confirmation of this now, we want to see price correct itself, trade us higher initially to set its first lower high before going on to create its new lower low.
Our entry confirmation will come via a penetration of this fractal Supply Zone followed by a fractal break in structure, this will confirm to us that the correction taking us up in this market has finished and the new bear run is ready.
From here all we need to do then is wait patiently for price to set us up nicely, pulling back into some fractal zones so we can look to go short. Its important we sit on our hands and wait patiently for price to take us up in this market to get us a better price when shorting.

AUDUSD Bearish BiasUADUSD is showing a strong Bearish move after CPI data. AUDUSD has broken a strong support area near 0.66000. Also, it have broken a strong trendline.
We are expecting a Re-Test at 0.66000 and then a Bearish Trend Continuation.

AUDUSD wave structure at 4-hour time frame4H is swing bullish => current is pullback dow
M15 is swing bullish => current is pullback dow
M5 is swing bearish
We buy up when the price passes through IDM

Buyers' appetite for the AUD has increasedBy examining the trend in the one-hour time frame, the Australian dollar is fluctuating in an upward channel, and considering the high rate of moving averages of the ALLIAGTOR indicator, the probability of the continuation of the upward trend is very high.
In general, this scenario is strengthened, that the rate can rise to the resistance of the ceiling of the ascending channel in the range of 0.6687, provided that no closing of the four-hour candle time is recorded below the support interval in the range of 0.6611-0.6598.

AUD/USD may rise 8 - 23 pips Daily and weekly charts bullishPivot
0.6590
Our preference
Long positions above 0.6590 with targets at 0.6615 & 0.6630 in extension.
Alternative scenario
Below 0.6590 look for further downside with 0.6575 & 0.6560 as targets.
Comment
Even though a continuation of the consolidation cannot be ruled out, its extent should be limited.
Supports and resistances
0.6645
0.6630
0.6615
0.6607 Last
0.6590
0.6575
0.6560
Number of asterisks represents the strength of support and resistance levels

Approaching pullback resistanceThe Aussie (AUD/USD) is rising towards the pivot which has been identified as a pullback resistance. Could this FX pair stall around this level before potentially reversing to drow lower towards the 1st support?
Pivot: 0.6616
1st Support: 0.6562
1st Resistance: 0.6639
Risk Warning:
Trading Forex and CFDs carries a high level of risk to your capital and you should only trade with money you can afford to lose. Trading Forex and CFDs may not be suitable for all investors, so please ensure that you fully understand the risks involved and seek independent advice if necessary.
Disclaimer:
The above opinions given constitute general market commentary, and do not constitute the opinion or advice of IC Markets or any form of personal or investment advice.
Any opinions, news, research, analyses, prices, other information, or links to third-party sites contained on this website are provided on an "as-is" basis, are intended only to be informative, is not an advice nor a recommendation, nor research, or a record of our trading prices, or an offer of, or solicitation for a transaction in any financial instrument and thus should not be treated as such. The information provided does not involve any specific investment objectives, financial situation and needs of any specific person who may receive it. Please be aware, that past performance is not a reliable indicator of future performance and/or results. Past Performance or Forward-looking scenarios based upon the reasonable beliefs of the third-party provider are not a guarantee of future performance. Actual results may differ materially from those anticipated in forward-looking or past performance statements. IC Markets makes no representation or warranty and assumes no liability as to the accuracy or completeness of the information provided, nor any loss arising from any investment based on a recommendation, forecast or any information supplied by any third-party.

Rising towards pullback resistance; could it reverse?AUD/USD is rising towards a resistance level which is a pullback resistance level and could reverse from this level to our take profit
Entry: 0.66244
Why we like it:
There is a pullback resistance level
Stop loss: 0.66672
Why we like it:
There is a pullback resistance level which aligns with the 161.8% Fibonacci extension
Take profit: 0.65513
Why we like it:
There is an overlap support level
Please be advised that the information presented on TradingView is provided to Vantage (‘Vantage Global Limited’, ‘we’) by a third-party provider (‘Everest Fortune Group’). Please be reminded that you are solely responsible for the trading decisions on your account. There is a very high degree of risk involved in trading. Any information and/or content is intended entirely for research, educational and informational purposes only and does not constitute investment or consultation advice or investment strategy. The information is not tailored to the investment needs of any specific person and therefore does not involve a consideration of any of the investment objectives, financial situation or needs of any viewer that may receive it. Kindly also note that past performance is not a reliable indicator of future results. Actual results may differ materially from those anticipated in forward-looking or past performance statements. We assume no liability as to the accuracy or completeness of any of the information and/or content provided herein and the Company cannot be held responsible for any omission, mistake nor for any loss or damage including without limitation to any loss of profit which may arise from reliance on any information supplied by Everest Fortune Group.

AUDUSD H1 setupAUSUSD has formed a major ChoCh at 65,600, and at the level of 65,300-65,400 there is a possibility of becoming RBS which is also the golden zone Fibo retracement area.

AUD/USD eyes confidence reportsThe Australian dollar has pushed higher on Monday. In the North American session, AUD/USD is trading at 0.6600, up 0.35%.
Australia’s Westpac consumer confidence is expected to rebound in April after a 1.8% decline in March. The market estimate stands at 0.5%. We’ll also get a look at the mood of the business sector, with NAB business confidence expected to fall to -3 in March, down from 0 in February.
Consumers and businesses are in a surly mood about the economy and last month’s pause from the Reserve Bank of Australia increased skepticism about a rate cut. The RBA has maintained the cash rate three straight times and hasn’t signaled when it will end its “higher for lower stance”.
The March RBA minutes didn’t mention the possibility of a rate hike, the first time that’s happened in the current tightening cycle, but the hot US nonfarm payrolls release may have pushed back the timing of an RBA cut. A rate cut from the RBA would have more impact if the Federal Reserve lowered rates first but the nonfarm payrolls data has pushed the likely timing of a first rate cut in the US from July to September.
US nonfarm payrolls jumped to 303,000 in March, up from a revised 270,000 in February and blowing past the market estimate of 200,000. The unemployment rate dipped lower to 3.8%, down from 3.9% and below the market estimate of 3.9%. Wage growth matched expectations at 4.1%, down from 4.3%.
The strong release points to a robust labour market, and investors have doubts if the Fed will cut more than twice this year. This mark a huge turnaround in market expectations – in January, an exuberant market had priced in six rate cuts in 2024, but the US economy is performing much better than expected despite high interest rates.
AUD/USD tested resistance at 0.6606 earlier. Above, there is resistance at 0.6632
0.6577 and 0.6551 are providing support


AUDUSD giving us technical buys, 1hrAUDUSD was in consolidation period in the 4hr timeframe hitting our demand and supply zones. Then broke our overall trendline all the way to touch the supply zone and came back to retest the trendline giving us an Inverse Head & Shoulder to confirm the buys of the AUDUSD. With a strong dollar to confirm AUDUSDs direction we can catch a few pips to the upside.
Audusd will cross all time high read the caption The US dollar eased slightly after the US published strong jobs numbers on Friday. According to the Bureau of Labor Statistics (BLS), the economy created over 303k jobs in March, higher than last month’s 270k. The figure was higher than the median estimate of 212k.
Additional data revealed that the unemployment rate retreated from 3.9% to 3.8% while the participation rate rose from 62.5% to 62.7%. The two figures were higher than the median estimate of 3.9% and 62.5% Wages also continued growing at a faster pace than EXPECTED
