BALUSDT trade ideas

Bal breakout _ scalpingBal breakout 4h
Good entry at 14 _ 14.77
Targets on the chart
Sl 13.60
Good luck

BAL/USDT SHORTbat brokedown from the trendline looking for more this can be a good short setup if btc keeps falling stoploss is tight incase btc pulls back

is history repeat again ? 🤔Hello traders 🐺 .
sometimes if you look at the chart deeply and with the enough precision , you are able to find very trade able patterns and make money out of them ; so this time it's BAL turn and I want to show you the possible upcoming trade , so stick with me until the very end and make sure to follow me for more support 🐺🙏 .
Let's start with the 3D chart to give you the overall view for the BAL situation and then we will go to the hourly chart to see the possible trade and the best entry point for the long position :
in the 3 days chart , we can see that previously when for the first time , BAL price rejected from the weekly resistance structure (red box) , BAL was started to retracement to the 8.3$ and during that retracement , BAL created a very clear descending channel , and currently we have the same thing again 🤔🤯 , if you look at the chart with more attention you will see that after the rejection from the weekly resistance structure or if I want to say clearly , when BAL failed to hold above the weekly support , comes down more and more ; after the secondary test of that structure , bears push BAL to the lower price targets even lower than the previous low and BAL currently trade around 10$ .
but what is important for us is the formation of the same pattern something very look likes from what we had in the past , if you remember I said in the beginning of the idea , BAL created the descending channel for the first time after the rejection from the weekly resistance , and now we have the almost same thing , but this time we have the falling wedge , which is the bullishly bias pattern , and in my opinion there is very strong chance for the BAL to repeat the history again and goes up to the ATH price 🐺🤯 .
Also if you look at the RSI value , you will see that in the RSI , we have the falling pattern again and in my opinion when RSI could break the resistance level , that would be a nice buy opportunity for the BAL .
let's goes to the 4H chart :
in the 4H chart BAL created a ascending triangle pattern which is also a bullish pattern , also price currently is at the support line so if price can goes above the 4H triangle there is strong chance for testing the upper trend line of the falling wedge .
Thank you guys for reading my idea , also don't forget to like my ideas and follow me for more support🙏 .


BALUSD BEARISH PENANT INDICATEBAL/USDT
BAL in the resistance area, we can wait for the breakout and the reaction from the resistance
Bearish trend still strong
Please dont rush and FOMO
#tipsfortradingplanning

Mid Term long BEL Triangle looking good im longing it I dont have much to say but it looks nice thats it

BALUSDT seems to be bullishBALUSDT seems to be bullish. The moving average of 20 crosses up the moving average of 50. If it break up the upper trend line it will be go high

Token BAL has broken its two-month downtrend lineEducational Tip ** Strategy of breaking the downtrend line and pullback to it **
Token bal has broken its two-month downtrend line and now we are witnessing a very beautiful pullback!
The lines of support and resistance ahead have been identified.
If the market trend is still good, the set goals will not be far from the mind.
First Support: $ 16.73
Target 1: up to 12%
Second target: up to 23%
Good luck profitable.

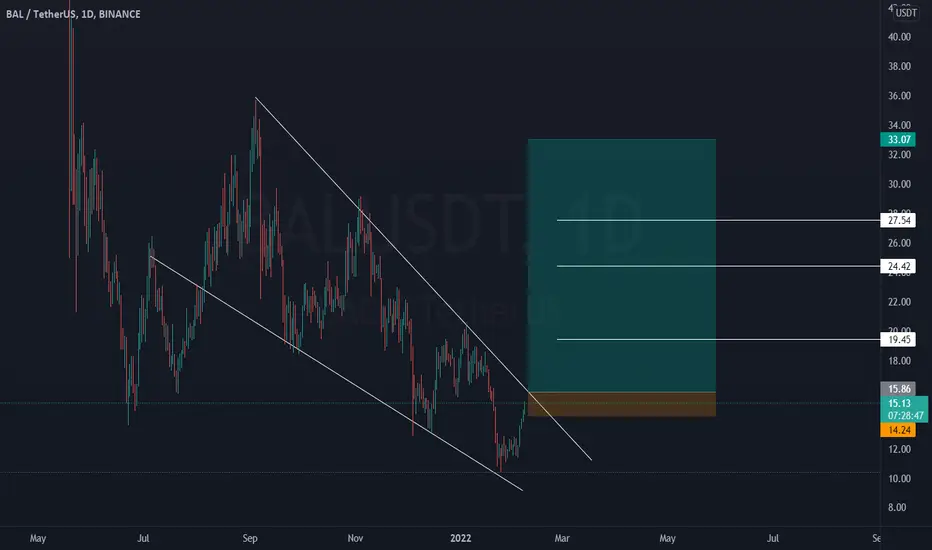
Bal/usdtFor short term if bal breaks 22 resistance and the trend line, it will go up to 24 and 26.
But if bal retest 13 support then we are going to buy it at 13.
If that happens our targets are
15
17
19
20
22
24
25
28
30
32
35

🔥 BAL Break Out Or Reversal: Huge PotentialSince BAL hit its all-time high value in May '21, this token has mainly been trading bearish.
However, BAL seems to be on a run lately, being one of the top performers of the last week or so. This massive bullish move has brought BAl to a huge resistance, the resistance from the ATH to the last local top.
In case of a bullish break out, I'm expecting a lot of volume pouring in. Targets are placed at recent local tops. However, it's also very possible that we're going to see a rejection of the resistance. I doubt whether we're going to move towards the support, but a couple of red days might be needed before we got the strength to push through the resistance.
Happy trading!

BALUSDT - New trend!BALUSDT (1D Chart) Technical analysis
BALUSDT (1D Chart) Currently trading at $19.69
Buy level:Above $19.48
Stop loss: Below $15.41
TP1: $22
TP2: $25
TP3: $29
Max Leverage 2x
Always keep Stop loss

BALUSDT : Short opportunity with good risk:rewardBalancer is again at the secondary lower trend line of resistance. Bitcoin also seems to be week on the 4h time frame, there is high probability of getting a rejection here and show some correction.
Also, the risk reward is also in our favor, I'm opening a futures trade for this short and hoping to either get stop loss or Target hit by tomorrow.
Please, leave a like if you like the analysis.

#BAL going long BAL is about to breakout of the 4H EMA band.
A retest for $17.5 could be in the cards, otherwise it may trend further up from here.

BAL/USDT LONGACCUMALATE some BAL/USDT
Buy :-
1. 10% for market price.
2. 30% AT 15.3$.
3. 30% AT 13.6$.
4. 30% AT 11.6$.
Sell :- 25$ ,29$ 33$, 40$.

BAL/USDT: Fight on very strong resistance right now!The BAL/USDT cryptocurrency pair is located just below the strong support/resistance area, which currently acts as resistance.
If this area is broken up and retested, the price of the BAL may rise to around 34.5, where another strong S/R area is located.
We are monitoring the situation and we will wait to see if all the conditions for entry are met, according to our strategy, so that we can successfully enter the trade.
Have a nice day and happy trading, Alex_UCT


Balancer (BAL) formed bullish Gartley for upto 135% moveHi dear friends, hope you are well and welcome to the new trade setup of Balancer (BAL) token.
On a weekly time frame chart, BAL has formed bullish Garltey move.

BAL try to break out, potential to increase 400%#BAL/USDT
$BAL going to break out from long term descending resistance.
close a daily candle above this descending resistance will confirm the uptrend move.
after a pullback to descending support, price can head up to break out falling wedge pattern and increase to resistance zone, in long term price have potential to touch $59 and even $100


BAL/USDT (Interval 1D) Bullish SharkBAL is making a bullish shark pattern on a daily chart, Everything has been mentioned to take this trade accordingly. Hopefully this pattern will play out if BTC stays stable.
