BAL to $30 Looks like a great entry for the Balancer coin. One of the Top DEX different EVM chains with over a billion dollar in TVL. Having fantastic tokenomics and continuous revenue throughout the bear market as well.
Definitely one of the low cap coin to keep in the bag.
Key stats
About Balancer

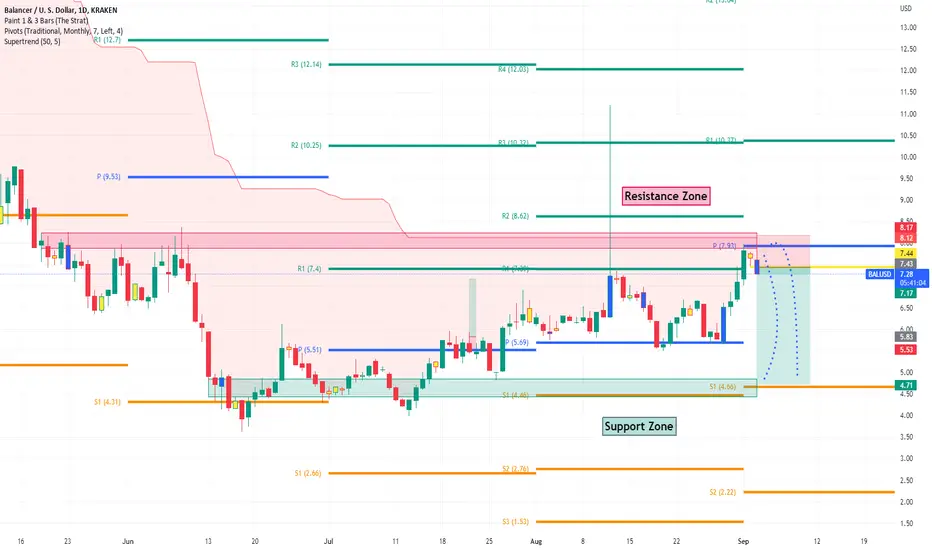
$BAL #Balancer Trading IdeaBAL/USD (Balancer) at this current moment is rising back up to retest that resistance box. If it breaks to the upside, through this red resistance zone, there is a potential to see another leg up on the price. Full send after a breakout.

Take a long on BALUSD on 4 hour time frame with sniper precisionThe sniper precision strategy that has confirmed with the upward arrow and breaking of resistance that is a minor one.be all hands on where to place sp

Balance #BAL breaking out inv. head & shouldersIt doesn't have huge targets
but it is a safe , solid , play .... meh
Good pattern though!

BAL/USD FEB21-28BAL/USD
1D Daily Chart
LOG Chart
possible $10 per bal?
reasons:
-climbing up making higher highs, higher lows, and climbing trendline
-golden lines represent support/resistance - clear the thick golden line successfully and an ultra bullish scenario can send it to $10

BALUSD - 35% Up o r 35% Down at Pinch Point!Hey guys, have you checked Balancer recently? It's reaching the very end of a pretty symmetrical triangle formation and this generally means something dramatic is about to happen!
BAL has tried to push the upper trend line acting as resistance once before and got denied, we're now at a critical poi

BALUSD4 hours dynamic reactor. Showing signs for a bounce here. If BTC and ETH does not make a big drop, BAL should bounce for decent gains!

#BALUSD short ideaHello dear Traders,
Here is my idea for #BAL
Price finds resistance at super trend line and closed below the yellow trigger line in the 4h chart. Trade already active.
Please feel free to ask any question in comments. I will try to answer all! Thank you.
BAL 20% Potential Gains on the BooksBAL looking to expand about 20% to the 1.618% Fibonacci if the TRR retest plays out -- and if BTC continues to behave. Please DYOR and trade at your own risk.

Balancer (BAL) - hidden bullish divergenceOn the above daily chart price action has corrected over 80% since May of last year. Now is an excellent time to be long. Why?
1) The ‘incredible buy’ signal printed.
2) Trend reversal, higher highs / higher lows are printing in price action and RSI.
3) Hidden bullish divergence. This is defined

See all ideas
Curated watchlists where BALUSD is featured.

AMM Coins: Automation is coming to a farm near you
20 No. of Symbols

Decentralized Exchange Tokens: Risky business?
22 No. of Symbols
See all sparks
Frequently Asked Questions
The current price of Balancer (BAL) is 2.60 USD — it has fallen 0.76% in the past 24 hours. Try placing this info into the context by checking out what coins are also gaining and losing at the moment and seeing BAL price chart.
The current market capitalization of Balancer (BAL) is 150.82 M USD. To see this number in a context check out our list of crypto coins ranked by their market caps or see crypto market cap charts.
Balancer (BAL) trading volume in 24 hours is 8.60 M USD. See how often other coins are traded in this list.
Balancer price has fallen by 4.76% over the last week, its month performance shows a 12.16% decrease, and as for the last year, Balancer has decreased by 41.96%. See more dynamics on BAL price chart.
Keep track of coins' changes with our Crypto heatmap.
Keep track of coins' changes with our Crypto heatmap.
Balancer (BAL) reached its highest price on May 12, 2021 — it amounted to 75.00 USD. Find more insights on the BAL price chart.
See the list of crypto gainers and choose what best fits your strategy.
See the list of crypto gainers and choose what best fits your strategy.
Balancer (BAL) reached the lowest price of 2.19 USD on Jul 5, 2024. View more Balancer dynamics on the price chart.
See the list of crypto losers to find unexpected opportunities.
See the list of crypto losers to find unexpected opportunities.
The current circulating supply of Balancer (BAL) is 64.25 M USD. To get a wider picture you can check out our list of coins with the highest circulating supply, as well as the ones with the lowest number of tokens in circulation.
Balancer has the limit of 96.15 M coins. No matter how the currency evolves, no new coins will be released after this number is reached.
The safest choice when buying BAL is to go to a well-known crypto exchange. Some of the popular names are Binance, Coinbase, Kraken. But you'll have to find a reliable broker and create an account first. You can trade BAL right from TradingView charts — just choose a broker and connect to your account.
Crypto markets are famous for their volatility, so one should study all the available stats before adding crypto assets to their portfolio. Very often it's technical analysis that comes in handy. We prepared technical ratings for Balancer (BAL): today its technical analysis shows the sell signal, and according to the 1 week rating BAL shows the sell signal. And you'd better dig deeper and study 1 month rating too — it's sell. Find inspiration in Balancer trading ideas and keep track of what's moving crypto markets with our crypto news feed.
Balancer (BAL) is just as reliable as any other crypto asset — this corner of the world market is highly volatile. Today, for instance, Balancer is estimated as 0.77% volatile. The only thing it means is that you must prepare and examine all available information before making a decision. And if you're not sure about Balancer, you can find more inspiration in our curated watchlists.
You can discuss Balancer (BAL) with other users in our public chats, Minds or in the comments to Ideas.