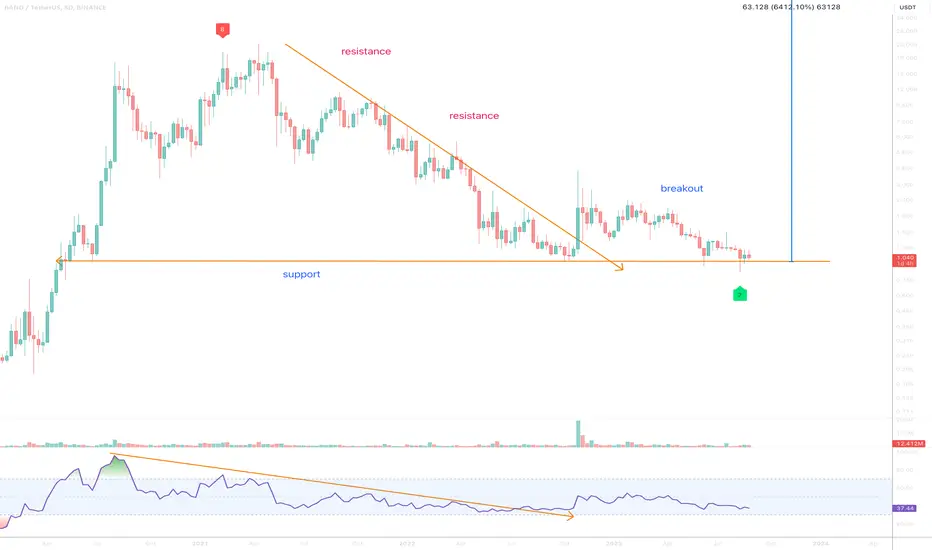
BANDUSDT IDEAHey traders hope you are enjoying our analysis. Now we are here again with a new trading opportunity. We will discuss today about BAND
Falling wedge Breakout Done in 6 H Timeframe ✅
Retesting in process✍️
Expecting +20% Bullish wave in coming day's 🚀📈

#BAND\USDT#BAND
'The price is moving in a downward trend on a 1-hour frame.
The price is moving within it and adhering to it to a large extent,
and it has just been breached. We have a tendency to stabilize above Moving Average 100.
We have a downtrend on the RSI indicator that supports the rise and has be

BANDUSDT LONG PhemexBAND The Forgotten 200% From 2022. I Charted this one time and it Ran from $0.10 to $18. this is the second time im charting this Currency. 2.222 is resistance IMO it smashes it.UP 4 Targets.

BANDUSDT 6H#BAND is moving above the support. If it keeps the support, it can reclaim the trend line. In this case, targets are:
$1.624
$1.859
$2.048
Main support: $1.382

BANDUSDT BOMB soonBANDUSDT BOMB soon 1h
BANDUSDT BOMB soon 1h
BANDUSDT BOMB soon 1h
BANDUSDT BOMB soon 1h
BANDUSDT BOMB soon 1h

BANDUSDT ready for a strong moveThis crypto has been bullish on the higher timeframe but recently we saw it retrace. However, on the 1H timeframe, a breakout of the triangle has occured and if price manages to keep doing higher highs and higher lows then my targets will be 2.25 and 2.50.

BANDUSDT - Triangle Breakout and Heading towards next ResistanceBINANCE:BANDUSDT (4H CHART) Technical Analysis Update
BANDUSDT is currently trading at 1.80 $ and and successfully breakout from the triangle pattern, its heading towards the next resistance around 2.0
We can expect the trend to continue and out final target is around 2.3
Long Entry level: $ 1.8

BAND will pump soonBefore anything else, you should note that the time frame is large and time-consuming (it is 2D).
BAND seems to be consolidating a triangle pattern, we are now in wave D of this triangle.
Wave D is a diamond diametric, which now seems to be in the bullish wave E of this diametric.
The target indi

Band Protocol (BAND) - Bullish divergence** Trading opportunity **
On the above 8-day chart price action has corrected 95% since April 2021. A number of reasons now exist to be long, including:
1) Price action and RSI resistance breakouts.
2) Regular bullish divergence. Seven Oscillators print positive divergence with price action over

See all ideas
Frequently Asked Questions
The current price of BAND / TetherUS (BAND) is 1.386 USDT — it has risen 0.65% in the past 24 hours. Try placing this info into the context by checking out what coins are also gaining and losing at the moment and seeing BAND price chart.
BAND / TetherUS (BAND) reached the lowest price of 0.192 USDT on Mar 13, 2020. View more BAND / TetherUS dynamics on the price chart.
See the list of crypto losers to find unexpected opportunities.
See the list of crypto losers to find unexpected opportunities.
Crypto markets are famous for their volatility, so one should study all the available stats before adding crypto assets to their portfolio. Very often it's technical analysis that comes in handy. We prepared technical ratings for BAND / TetherUS (BAND): today its technical analysis shows the sell signal, and according to the 1 week rating BAND shows the strong sell signal. And you'd better dig deeper and study 1 month rating too — it's sell. Find inspiration in BAND / TetherUS trading ideas and keep track of what's moving crypto markets with our crypto news feed.
BAND / TetherUS price has fallen by 7.04% over the last week, its month performance shows a 2.87% decrease, and as for the last year, BAND / TetherUS has decreased by 4.02%. See more dynamics on BAND price chart.
Keep track of coins' changes with our Crypto heatmap.
Keep track of coins' changes with our Crypto heatmap.
BAND / TetherUS (BAND) reached its highest price on Apr 15, 2021 — it amounted to 23.305 USDT. Find more insights on the BAND price chart.
See the list of crypto gainers and choose what best fits your strategy.
See the list of crypto gainers and choose what best fits your strategy.
BAND / TetherUS (BAND) is just as reliable as any other crypto asset — this corner of the world market is highly volatile. Today, for instance, BAND / TetherUS is estimated as 4.17% volatile. The only thing it means is that you must prepare and examine all available information before making a decision. And if you're not sure about BAND / TetherUS, you can find more inspiration in our curated watchlists.
You can discuss BAND / TetherUS (BAND) with other users in our public chats, Minds or in the comments to Ideas.
BAND / TetherUS highest price ever is 23.305 USDT, and the maximum drawdown from this value it has ever experienced is 12.02 K%, when BAND / TetherUS reached 0.192 USDT. See more of BAND price dynamics on the chart.
The safest choice when buying BAND is to go to a well-known crypto exchange. Some of the popular names are Binance, Coinbase, Kraken. But you'll have to find a reliable broker and create an account first. You can trade BAND right from TradingView charts — just choose a broker and connect to your account.