NFLXD trade ideas

NETFLİX BULLİSH CAN COME!!!Hello guys,
I wanna share my idea about netflix.I think rise will come after this EMA cutting. Why bullish will come? Let's answer this question.
Reasons of rise possibility:
1)We are on the very strong support.This will affect investor for buy netflix.
2) 5 length EMA can cut 20 length EMA at the future days.
3)We see mismatch between MACD and Chart.(Most important signal in my opinion)
This reasons can affect investors for Buy netflix share.
I show STOP LOSS area with ATR strategy on the chart.
Actually I think, This seems good oppurtunity for Buy netflix share.
NOT İNVESTEMENT ADVİCE THATS ONLY MY OPİNİONS.
Thanks

NETFLIX - Short Position Technical point of view if the price breaks below the 190 level, most probable we are still in a strong downtrend we might hit the next support levels accordingly.

NFLX BEARISHFailed to break the 0.5 fib. Clear bearish rising wedge, with shooting star candle on the daily. MACD also looking to create a bearish crossover.

Stock Analysis: Netflix Netflix is in a powerful downtrend in the Daily Chart, already under the 200ma. That makes us interest in seeking short positions in the stock, however, there are technical indications that a deeper PB can happen in the coming weeks (MACD divergence), so we advise waiting price make higher highs to sell short with a better entry price.

NFLX inside bar on dailyNFLX has an inside bar on daily. Will buy put if it breaks under 198.9 and calls over 202.5. I'm more bearish due to the upcoming events. FOMC meetings and market conditions.
Trade idea:
6/17 NFLX buy 1x195 put
sell 2x190 put
buy 1x185 put

Netflix INC - Buy the dipAs we mentioned on May 13 when the spot rate was 174, the market has found a floor at 165 and went into A positive reaction to 205.
The upward move is not over yet and there is still an opportunity to go long again.
We recommend buying the dip with a stop loss at 169 and a take profit at 245 and 280.

NFLX:If it looks like a bottom. . . ?!!Netflix
Short Term - We look to Buy a break of 210.00 (stop at 158.96)
The bullish engulfing candle on the daily chart is positive for sentiment. A bullish reverse Head and Shoulders is forming. This is positive for sentiment and the uptrend has potential to return. Further upside is expected to close the gap between 248.70 and 333.22.
Our profit targets will be 329.00 and 400.00
Resistance: 240.00 / 330.00 / 400.00
Support: 160.00 / 125.00 / 81.00
Please be advised that the information presented on TradingView is provided to Vantage (‘Vantage Global Limited’, ‘we’) by a third-party provider (‘Signal Centre’). Please be reminded that you are solely responsible for the trading decisions on your account. There is a very high degree of risk involved in trading. Any information and/or content is intended entirely for research, educational and informational purposes only and does not constitute investment or consultation advice or investment strategy. The information is not tailored to the investment needs of any specific person and therefore does not involve a consideration of any of the investment objectives, financial situation or needs of any viewer that may receive it. Kindly also note that past performance is not a reliable indicator of future results. Actual results may differ materially from those anticipated in forward-looking or past performance statements. We assume no liability as to the accuracy or completeness of any of the information and/or content provided herein and the Company cannot be held responsible for any omission, mistake nor for any loss or damage including without limitation to any loss of profit which may arise from reliance on any information supplied by Signal Centre.

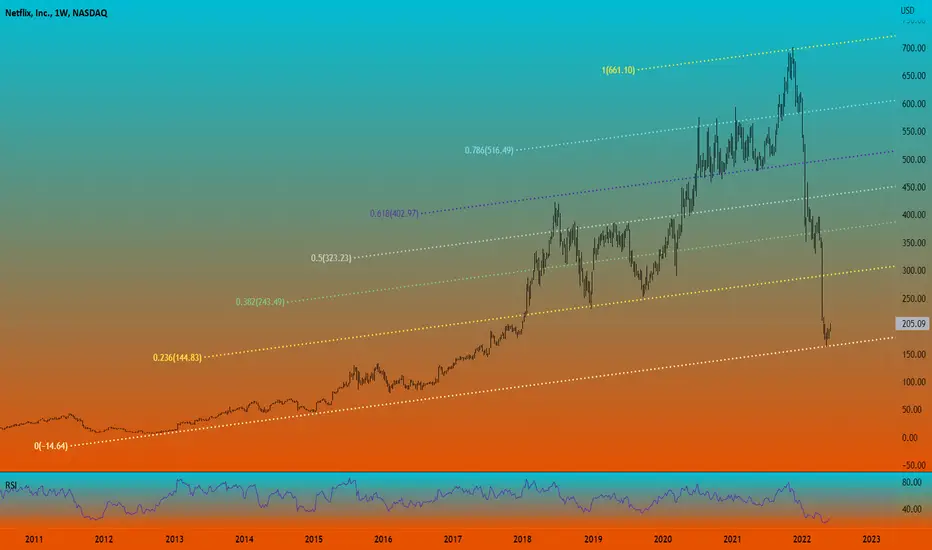
NFLX - What does this chart tell YOU? This is a weekly NFLX chart with the Fibonacci Channel applied to it dating back to the 2012 timeframe.
You could not have constructed this channel until the top was established so it wouldn't have done you much good on the front side of the move.
HOWEVER ... What this chart confirms to ME is the bottom is in.
WHY?
Look at the beautiful symmetry the chart displays at the respective Fibonacci levels. Remarkable isn't it?
That's enough confirmation to me this stock has seen it's low because one of the key points you need to use to construct the channel is the local low.
If this is not the low the past interaction with the Fibonacci levels would not line up as they do on this chart.
NFLX - Consolidating nicely
Ascending triangle pattern on 4H, which positive MACD suggests higher prices could follow.
Downside risk is always but I'd favor this for a run up to 200/204.
I have starter position at 181 with stop loss at 175.

breakout is on the horizon, we must be patient ✅NFLX in consolidation faze for over a month now, I expect a nice rally once we breakout from it but sitting on sidelines for now.
some local resistance at 206, once this break calls can pay, can also wait for 230.91 to break if you want to play it safe.

NFLX Breakout Upward to Fill April Gap?After a long period of trading sideways NFLX seems to be ready for a move. I do think if it can hit $205 that would be a solid indicator of a push upward. What does everyone else think?
NFLX

Buy stop!I definitely like that bullish momentum with volume and although it did not dip to my level rather it bounced on the 30m ssb. I will put a buy stop at 198 so that I am only taken in if right and stop 184. The ultimate target is 250 zone but will add and remove as appropriate. The R is 3.58 if I take it all the way up;)

NefliX:Day trade?. . . .which could turn swingTurned mildly bullish on Netflix on 31 May with a tk cross. However the volume was not convincing so today will be doing just a day trade to test my bullish thesis. If successful then my day trade can potentially turn into a swing. On the monthly we had a bullish hammer caused by the monthly lagging failure to cross down the monthly SSB. If this persists then we might have a pullback to the 233-240 zone. The streak of strong bearish months from November means whatever long position should be taken with extreme caution as the overall trend remains bearish and we are attempting to catch knives so to speak.
For the day trade I am targeting the daily kijun zone for a bounce and will be bullish from there with a tight stop. I need to see a good conviction bullish 30min candle bouncing from that red zone or somewhere close to that. The stop will be just below that zone.

4 biggest declines in history...Here are the 4 largest (over 50% ) pull back in NFLX history. We are "at that range" . Yes, we can go down more, but I will begin my accumulation process here, with buying 5 shares every 2-3 days...
:-)
And I will sell a put for July below the 200 SMA on a monthly chart. :-)

Bullish Pattern Indicate A Major Reversal For Netflix Shares.Netflix formed the possible head-and-shoulders pattern between April 26 and May 26, with the left shoulder created over the first seven trading days within the time period, the head over the subsequent eight days and the right shoulder was printed over the eight days that followed. On Tuesday, Netflix retraced slightly lower to back test the neckline of the pattern and held above it.
Netflix’s relative strength index (RSI) has been making a series of higher highs and higher lows, which indicates momentum into the stock is increasing. Netflix’s RSI is currently measuring in at about 43%, which indicates the stock has room to move in either direction before entering into oversold or overbought territory but the indicator is suggesting more upside.
Netflix is trading in a confirmed uptrend, with the most recent higher high printed on Tuesday at the high-of-day and the most recent higher low formed at the $177.17 mark on May 24. Eventually, Netflix will retrace to print another higher low, which could provide an entry point for bullish traders who aren’t already in a position.
Netflix has two gaps above, with the closest gap falling between $248.70 and $333.22. Gaps on charts fill about 90% of the time, which indicates Netflix will rise up to fill the empty trading range in the future, although it could be some time before that happens.
Netflix has resistance above at $200.82 and $212.98 and support below at $186.40 and $178.38.

''NETFLIX'' bullish trend''NETFLIX'' after having had a big downtrend we will see a return of an uptrend after having the SprintBox candle


Logarithmic Channel Since IPOSince 2002, Netflix has remained in a constructed bullish channel. With an RSI-based MA to compliment an established bottom, $NFLX has tapped the support of this channel only twice in its public history before racing to new ATHs in a few years.
I believe the risk-to-reward ratio at these prices has significantly improved, allowing those with a long-term view to construct a position more confidently.

perfect channel for Netflix, still more room to go down perfect channel for Netflix, still more room to go down before turning upward, let us watch.

NFLXNetflix shares have fallen sharply recently due to bad news about the company's users falling
But that reduction is too much, and I expect it to have at least one retreat towards the $ 333 and $ 478 targets.
MACD and RSI indicators are in the floor area and sellers do not seem to be able to reduce the price and the price in the area is between $ 180 and $ 200.

$NFLX Long at Montlhy DemandNFLX has found some buying pressure at monthly demand. Being that the market is oversold into the big picture downtrend and we have rallied away, potential upside in many stocks is a great buying opportunity. NFLX closed above the 20 SMA on the Daily and is forming a rounded bottom breakout. Target into the fib discount zone between 216 and 230. Looking for a top target of 230-250 over the next 3 weeks.

NFLX for a bounceNFLX is still oversold after forming a near term bottom. Looking for a bounce to $220-252 range. It's hard to find anything to short in this market with so many stocks oversold and at/ near 52 week lows. Bear markets can have violent spectacular rallies on the way down which is why I am entirely long this week. GL
