Current primary.If we have a reaction at these levels, i will be even more secured about the macro triangle.
Waves C in triangles are most likely to develop into a complex structure (multiple zig zags or triangle as a whole wave c)
TSLA trade ideas

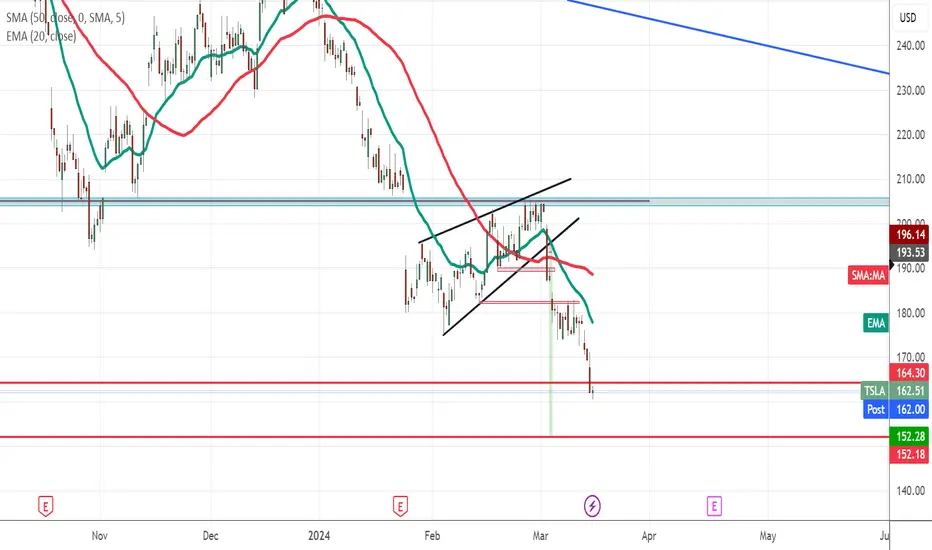
TESLA: Long Trade Explained
TESLA
- Classic bullish setup
- Our team expects bullish continuation
SUGGESTED TRADE:
Swing Trade
Long TESLA
Entry Point - 163.56
Stop Loss - 152.38
Take Profit - 186.82
Our Risk - 1%
Start protection of your profits from lower levels
❤️ Please, support our work with like & comment! ❤️

TSLA 2024-03-16 could go lowerNASDAQ:TSLA is at multiple resistance levels. In short term, it could bounce back a bit. If it goes down further, the next level is around $120

Tsla ... Trend linesTesla can have good growth by breaking the trend line. Because I see divergence , in the Rsi /, there is a lot of possibility to rise, but if can't breaks the trend line, it will go lower

TSLA POTENTIAL TO $200It is expected to travel up to $200. Stop loss is shown at the low of the shown demand zone. I am in.


Institutional purchase at $165 : I hope I'm not mistaken.I bought earlier because I couldn't manage my emotions hahaha. Since it was at 210 or 215, I had placed my orders at $165, but I couldn't resist FOMO during the drop lol.
Earnings are forecast to grow 10.62% per year
Earnings grew by 19.2% over the past year

TeslaTesla key level for the bulls is 185.56, thought the bears are still selling hard ,the break out the major retest is coming for the buyers...

TSLA - ripe for a countertrend move?Red count from the last update here seems to be the possible winner.
Got some decent RSI divergence going on here on the daily and 4h.
If this plays out as a leading diag to the downside, a retracement might very well go into 250+ before continuing further down.

TESLA MONTHLY FORECASTTESLA seems to hit important resistance at the 300 usd zone.
The 2020 RUN is a perfect 1,2,3,4,5 elliot wave impulse, for that reason is that now we are facing a possible ABC correction at the fib's zone here defined using all the 2020 bullrun impulse.
Wave A= face 0,382 @ 105 usd
Wave B (retesting bull wave)= 300 usd
Still in play correction to:
Wave C= 0,5 @ 70 usd
or
Wave C (plain A=C) = repeting 0,382 @ 105 usd
I dont think 0,618 its gonna happend for the moment ...

TESLA The time to buy is NOW. Huge +40% upside.Tesla / TSLA hit the Falling Support today, which is the bottom of the Bearish Megaphone started after the July 19th 2023 High.
On top of that, the 1day RSI turned oversold, entering the Support Zone that has priced all 4 bottoms and buy opportunities since the April 27th 2023 Low.
That Low was at 152.40, marginally under the current price.
As you realize, this is technically the strongest buy opportunity of the year and in price action terms, looks very much like the April 2023 bottom.
Keep a medium term perspective, buy and target the 1day MA200, near the Falling Resistance and just under the 0.786 Fibonacci at 230.00.
Follow us, like the idea and leave a comment below!!

TSLA update We have hit TP1 with a good swing down to $164!!!!
secure profits... avoid greed and repeat
TSLA Mar. 2024 updateAll equity appearing in this post are fictitious.
Any resemblance to real currencies, existing or dead, is purely coincidental.

SHORT | TSLA NASDAQ:TSLA
Possible Scenario: SHORT
Evidence: Head & Shoulder Pattern on weekly Timeframe
Price Targets:
TP1: 200$
TP2: 164$
TP3: 100$
Timeframe: 2024

BULL Case for Tesla TSLAI guess this wouldn't be a mad place for a turnaround.
Would be a knife catching action, but keep an eye on the LTF for signs of it.
Stay safe, Friends!
XOXO

Tesla UPSIDE(LowRiskHighReward)Tesla has been on a downtrend that could be reversed if major support price of 160.00 can hold, this would definetly be a buy zone with minimal risk and HIGH reward.

TSLA- When To BUY ?Hello- TSLA Came Out Of The BB 200 Dayly Lower Which Could Accelerate The Decline.

Tesla's breakdown from Wedge pattern could find support at $166Tesla's breakdown from Wedge Pattern will likely take price to the lower bound of the parallel channel. We expect the price to find support at $166 and get bounce back to the resistance line of $214 if the support line holds

Tesla Risky Entry Possibility for Buy is formed Tesla Risky Entry Possibility for Buy is formed on bigger time.
RR 1:5,
The upper dot line is first half TP point.

TESLA just set the new target down to $100 - Problems for EVsTechnically we see an M Formation on Tesla.
The price broke below the neckline and the price is both below the 20MA and the 200MA.
The nature of this analysis is HIGH probability.
We, can set the first target to $100 and then next to $80. And if it breaks further we are talking $60....
But let's see.
There is fire in the EV space. With crashes, glitches, malfunctions, issues with snow, unable to track correctly objects on the streets and identifying.
There are also issues with having parts reordered when they breakdown.
And Elon is focussing more of his attention on X and SPace X. So this is not convincing and promising to shareholders to keep holding.

✅TESLA BEARISH BREAKOUT|SHORT🔥
✅TESLA is trading in a
Strong downtrend and
The stock broke yet another
Support level around 178$
Which reinforces our bearish
Bias and makes us expect
A further move down
SHORT🔥
✅Like and subscribe to never miss a new idea!✅

TSLA Bearish outlookTsla looks bound to hit the next bottom support which is 163
RSI is not even oversold yet so there is a chance that it can go below 163 and next stop would be 150-152 range
150 is the channel bottom as well . so we might have a chance of a bounce back technically.
If it goes below 150 and a trading day closes below 150 then we are going to 100-105 range which is the ultimate rock bottom for TSLA

$TSLA Daily chart analysis: For educational purposes only. NFANASDAQ:TSLA Daily chart analysis: For educational purposes only. NFA
Bullish case: March 13, 2024
1# Price made new lower low and near a big support level
2# RSI indicator showing Bullish Divergence
3# Expecting a bounce from this support and aiming price target of $192-197 range.
