AmazonAmazon has given us small push up but slow last week, we will expect some more drop this week before a major push up.
Disclosure: We are part of Trade Nation's Influencer program and receive a monthly fee for using their TradingView charts in our analysis.
Key facts today
Next report date
—
Report period
—
EPS estimate
—
Revenue estimate
—
6,250 CLP
59.13 T CLP
636.69 T CLP
9.66 B
About Amazon.com, Inc.
Sector
Industry
CEO
Andrew R. Jassy
Website
Headquarters
Seattle
Founded
1994
ISIN
US0231351067
FIGI
BBG00YFSC9Z6
Amazon.com, Inc. is a multinational technology company, which engages in the provision of online retail shopping services. It operates through the following segments: North America, International, and Amazon Web Services (AWS). The North America segment offers retail sale of consumer products, including from sellers, advertising, and subscriptions services through North America-focused online and physical stores. The International segment focuses on retail sale of consumer products, including from sellers, advertising, and subscription services through internationally-focused online stores. The AWS segment is composed of global sales of compute, storage, database, and other services for start-ups, enterprises, government agencies, and academic institutions. The company was founded by Jeffrey P. Bezos in July 1994 and is headquartered in Seattle, WA.
Related stocks
AMAZONAMZN is almost ready to push up further to take ATH.
Disclosure: We are part of Trade Nation's Influencer program and receive a monthly fee for using their TradingView charts in our analysis.

AWS REVENUE CONCERNS EASED! AMZN EARNINGS MULLIGAN! FULL PORT + NEXT 2 WEEKS OF AMAZON DRIVER WAGES INTO CALLS
26 x 285c 12/19, 5x 280c 11/21
Speculation: We melt up to 235 then pop north for ~10% on the earnings beat + rate cut with SPY 700 EOY projections (In line with GOLDMAN SACHS and WELLS FARGO )
6 of the last 8 earnings reports for AMZN

Amazon end of accumulation and expansion will beginAmazon has likely completed its accumulation phase and is showing signs of renewed bullish momentum. A breakout above recent resistance could confirm the start of a new upward trend.
Levels to watch: 232 - 252
⚠️ Not financial advice.

Breaking: AMZN Bullish Trend Near Key Breakout Levels Current Price: $219.51
Direction: LONG
Targets:
- T1 = $230.00
- T2 = $245.00
Stop Levels:
- S1 = $215.00
- S2 = $210.00
**Wisdom of Professional Traders:**
This analysis synthesizes insights from thousands of professional traders who closely monitor the unique dynamics surroun

$AMZN massive cup and handle formingIf we look at the chart of AMZN, we can see that $236 has become an important resistance level.
So far, it's been tested multiple times which means that resistance has weakened. I do think that next time we get up to that level, it'll likely break and we can see higher prices.
On top of the resist

AMZN Break Out -- Bullish1HR time frame paints a good picture of what's to come in the short term...at least from my perspective.
AMZN finally broke through the sideways chop today with momentum and pushed to the 1.618 fib (from the closed peak of the last wave on 10/3 to the closed low on 10/6).
RSI showing momentum and

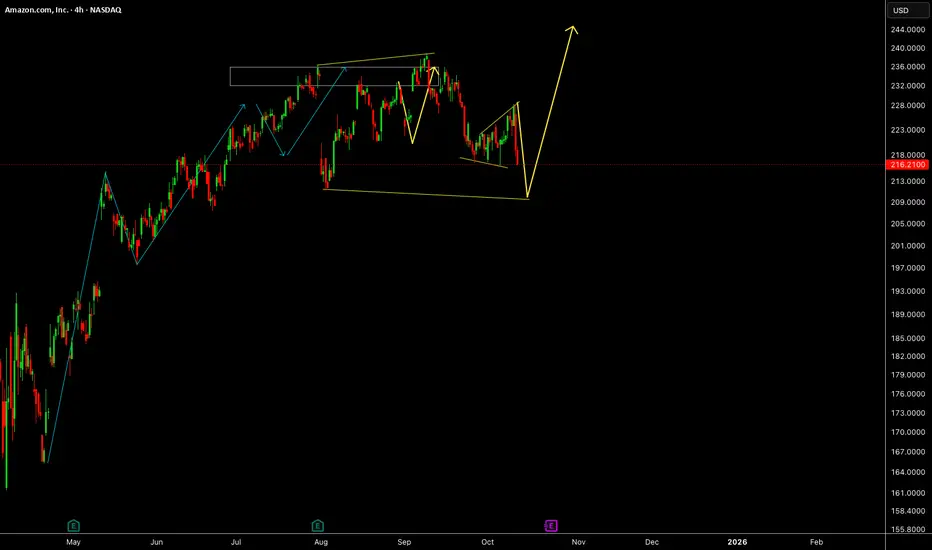
AMZN OCT 2025AMZN (4H) — Clear rejection from RES 235–244, where heavy sell-side distribution capped every bounce (25B sold marked). Price is compressing under the descending trendline while buyers keep absorbing near 210; 200 remains the next key demand, with a downside gap lurking below.
Targets:
Upside: Bre

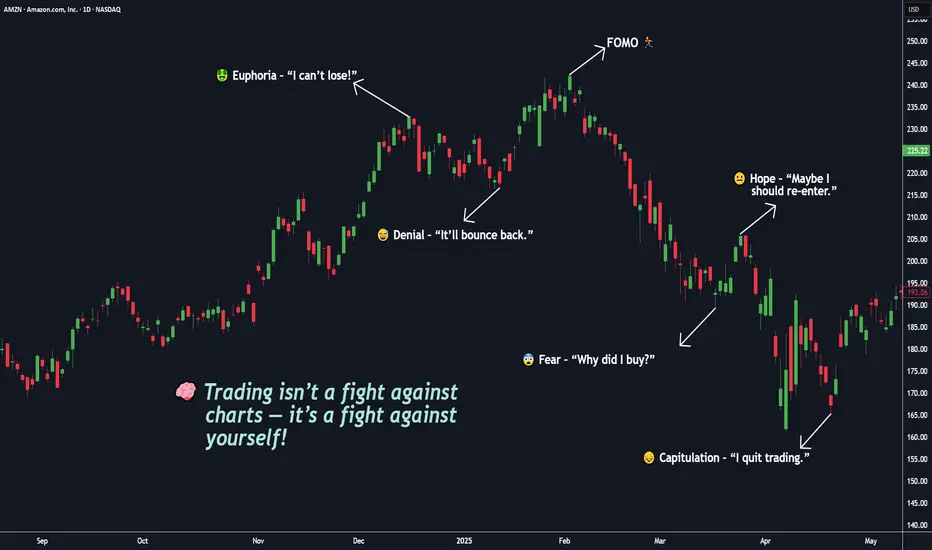
You’re Not Competing With the Market, You’re Competing With Self🧠 Trading isn’t a fight against charts — it’s a fight against yourself.
If you’ve ever told yourself “I’ll just take one more trade”, you already know this battle.
But in truth — the real battle happens inside your mind.
You start your day with discipline: BITSTAMP:BTCUSD , NASDAQ:AMZN , OANDA
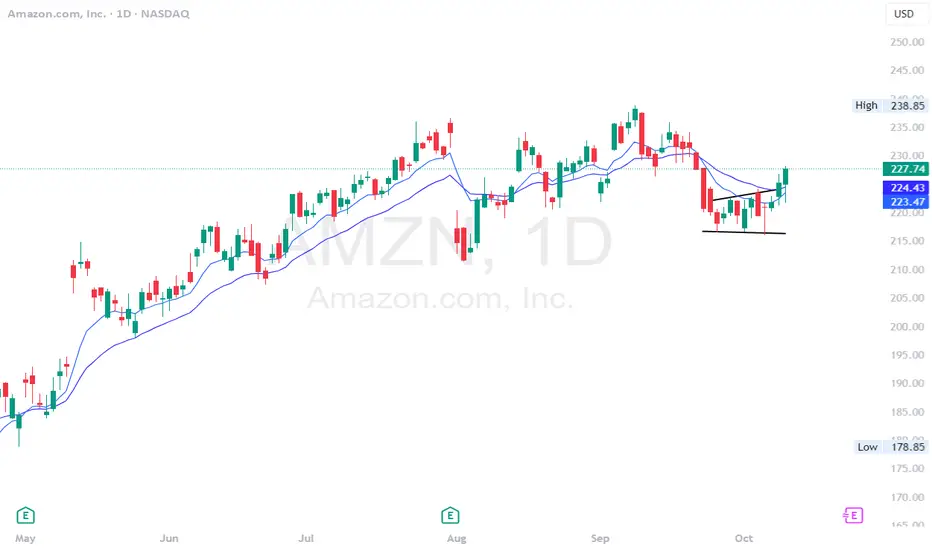
$AMZN - breakout move incomingAMZN - Stock breaking out of consolidation channel on the daily. seeing multiple call flow come in. calls above $230 look good for a breakout move towards all time highs and $250. Stock is strong on indicators.
See all ideas
Summarizing what the indicators are suggesting.
Neutral
SellBuy
Strong sellStrong buy
Strong sellSellNeutralBuyStrong buy
Neutral
SellBuy
Strong sellStrong buy
Strong sellSellNeutralBuyStrong buy
Neutral
SellBuy
Strong sellStrong buy
Strong sellSellNeutralBuyStrong buy
An aggregate view of professional's ratings.
Neutral
SellBuy
Strong sellStrong buy
Strong sellSellNeutralBuyStrong buy
Neutral
SellBuy
Strong sellStrong buy
Strong sellSellNeutralBuyStrong buy
Neutral
SellBuy
Strong sellStrong buy
Strong sellSellNeutralBuyStrong buy
Displays a symbol's price movements over previous years to identify recurring trends.
US23135CC8
Amazon.com, Inc. 3.25% 12-MAY-2061Yield to maturity
5.32%
Maturity date
May 12, 2061
US23135CK0
Amazon.com, Inc. 4.1% 13-APR-2062Yield to maturity
5.31%
Maturity date
Apr 13, 2062
US23135BT2
Amazon.com, Inc. 2.5% 03-JUN-2050Yield to maturity
5.29%
Maturity date
Jun 3, 2050
AMZN4996701
Amazon.com, Inc. 2.7% 03-JUN-2060Yield to maturity
5.29%
Maturity date
Jun 3, 2060
AMZN5182959
Amazon.com, Inc. 3.1% 12-MAY-2051Yield to maturity
5.26%
Maturity date
May 12, 2051
US23135CJ3
Amazon.com, Inc. 3.95% 13-APR-2052Yield to maturity
5.26%
Maturity date
Apr 13, 2052
AMZN4531868
Amazon.com, Inc. 4.25% 22-AUG-2057Yield to maturity
5.26%
Maturity date
Aug 22, 2057
AMZN4531866
Amazon.com, Inc. 4.05% 22-AUG-2047Yield to maturity
5.18%
Maturity date
Aug 22, 2047
US23135AQ9
Amazon.com, Inc. 4.95% 05-DEC-2044Yield to maturity
5.01%
Maturity date
Dec 5, 2044
AMZN5182958
Amazon.com, Inc. 2.875% 12-MAY-2041Yield to maturity
4.97%
Maturity date
May 12, 2041
AMZN4531864
Amazon.com, Inc. 3.875% 22-AUG-2037Yield to maturity
4.70%
Maturity date
Aug 22, 2037
See all AMZNCL bonds
Curated watchlists where AMZNCL is featured.


Frequently Asked Questions
The current price of AMZNCL is 212,900 CLP — it hasn't changed in the past 24 hours. Watch Amazon.com, Inc. stock price performance more closely on the chart.
Depending on the exchange, the stock ticker may vary. For instance, on BCS exchange Amazon.com, Inc. stocks are traded under the ticker AMZNCL.
AMZNCL stock has fallen by −1.84% compared to the previous week, the month change is a −4.96% fall, over the last year Amazon.com, Inc. has showed a 22.85% increase.
We've gathered analysts' opinions on Amazon.com, Inc. future price: according to them, AMZNCL price has a max estimate of 291,984.73 CLP and a min estimate of 219,465.65 CLP. Watch AMZNCL chart and read a more detailed Amazon.com, Inc. stock forecast: see what analysts think of Amazon.com, Inc. and suggest that you do with its stocks.
AMZNCL reached its all-time high on Dec 19, 2024 with the price of 238,000 CLP, and its all-time low was 71,520 CLP and was reached on Jan 5, 2023. View more price dynamics on AMZNCL chart.
See other stocks reaching their highest and lowest prices.
See other stocks reaching their highest and lowest prices.
AMZNCL stock is 1.26% volatile and has beta coefficient of 1.30. Track Amazon.com, Inc. stock price on the chart and check out the list of the most volatile stocks — is Amazon.com, Inc. there?
Today Amazon.com, Inc. has the market capitalization of 2,201.87 T, it has increased by 0.61% over the last week.
Yes, you can track Amazon.com, Inc. financials in yearly and quarterly reports right on TradingView.
Amazon.com, Inc. is going to release the next earnings report on Oct 23, 2025. Keep track of upcoming events with our Earnings Calendar.
AMZNCL earnings for the last quarter are 1.57 K CLP per share, whereas the estimation was 1.24 K CLP resulting in a 26.44% surprise. The estimated earnings for the next quarter are 1.51 K CLP per share. See more details about Amazon.com, Inc. earnings.
Amazon.com, Inc. revenue for the last quarter amounts to 156.88 T CLP, despite the estimated figure of 151.94 T CLP. In the next quarter, revenue is expected to reach 171.57 T CLP.
AMZNCL net income for the last quarter is 16.99 T CLP, while the quarter before that showed 16.33 T CLP of net income which accounts for 4.07% change. Track more Amazon.com, Inc. financial stats to get the full picture.
No, AMZNCL doesn't pay any dividends to its shareholders. But don't worry, we've prepared a list of high-dividend stocks for you.
As of Oct 13, 2025, the company has 1.56 M employees. See our rating of the largest employees — is Amazon.com, Inc. on this list?
EBITDA measures a company's operating performance, its growth signifies an improvement in the efficiency of a company. Amazon.com, Inc. EBITDA is 126.94 T CLP, and current EBITDA margin is 19.15%. See more stats in Amazon.com, Inc. financial statements.
Like other stocks, AMZNCL shares are traded on stock exchanges, e.g. Nasdaq, Nyse, Euronext, and the easiest way to buy them is through an online stock broker. To do this, you need to open an account and follow a broker's procedures, then start trading. You can trade Amazon.com, Inc. stock right from TradingView charts — choose your broker and connect to your account.
Investing in stocks requires a comprehensive research: you should carefully study all the available data, e.g. company's financials, related news, and its technical analysis. So Amazon.com, Inc. technincal analysis shows the sell today, and its 1 week rating is buy. Since market conditions are prone to changes, it's worth looking a bit further into the future — according to the 1 month rating Amazon.com, Inc. stock shows the buy signal. See more of Amazon.com, Inc. technicals for a more comprehensive analysis.
If you're still not sure, try looking for inspiration in our curated watchlists.
If you're still not sure, try looking for inspiration in our curated watchlists.