XOM trade ideas

$XOM with a Bearish outlook following its earnings #Stocks The PEAD projected a Bearish outlook for $XOM after a Negative Under reaction following its earnings release placing the stock in drift D
If you would like to see the Drift for another stock please message us. Also click on the Like Button if this was useful and follow us or join us.

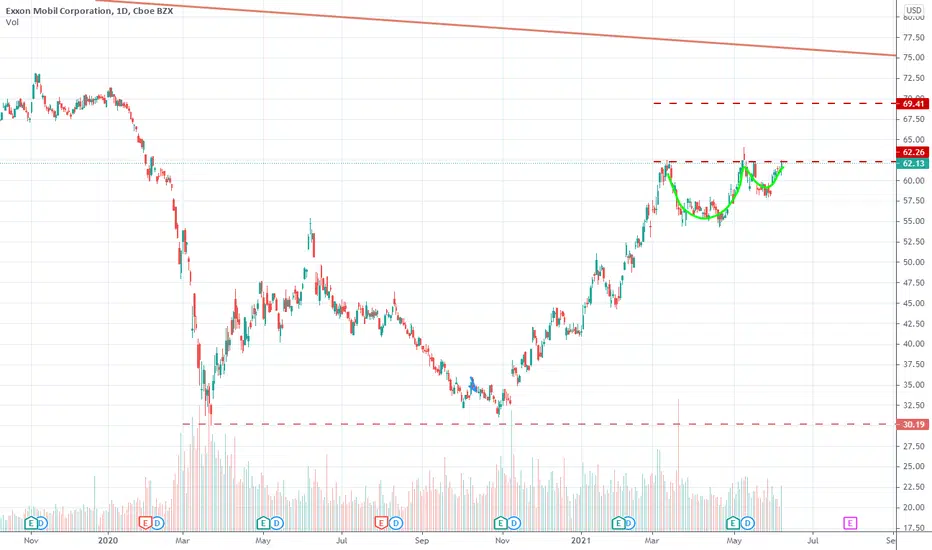
Great Entry on XOMXOM has hit its Fibonacci Support while also showing signs that a bullish squeeze may appear. There has been a reduction in selling momentum while the Willy Shows a potential EMA crossover to be had. We have weekly resistance at 62.50 which would be a great point to watch if choosing to go long on this stock. A wise decision may be to wait for bullish momentum and for an ema crossover to officially occur to make sure this isn't a false signal.
Bullish Signals
-Potential EMA crossover
-Squeeze indicator
-Fibonacci Support
Weekly Resistance
-62.50

Exxon Mobil touching Pre-COVID low prices | Fundamentals/TechnicDisclaimer: I am not a FINANCIAL advisor as this is just my own due diligence. It is not intended as legal, financial or investment advice and should not be construed or relied on as such. Before making any commitment of a legal or financial nature you should seek advice from a qualified and registered legal practitioner or financial or investment adviser.
Exxon Mobil and other OIL giants regardless if they're midstream, upstream, lowstream oil companies, has been one of the industries that has underperformed the market for a LONG time.
Technicals:
As seen in the chart, there's good reason for XOM to hold this support level (highlighted in green) and as of right now, there's a major confluence area with the support level and the 200 EMA: ohlc4.
The only thing that we're looking for, in XOM is for the RSI to break-through 50.
Not only that, but when we cross-reference USOIL/XOM it's currently hovering above 1.2:
USOIL/XOM
What this chart tells us is if XOM's percentage change is any different to USOIL's percentage change. Historically speaking, USOIL/XOM has only ever been below 0.5-0.9 which is a sign that XOM always overpowers USOIL's percentage change (This has been consistent ever since 2015)
It has been traded at a very unfair price in proportion to WTI and USOIL and that shows on the USOIL/XOM ratio
Now time for the fundamentals, the main bullish thesis for XOM:
Exxon has repeatedly and consistently beat earnings for the past FOUR quarters and none of those earnings beat have been less than a 5% beat. With a consistent trend of beating earnings, Exxon could be on the horizon of breaking through Pre-COVID lows .
Not only that, but during the recession, the company has done tremendous work on restructuring the company and have been working on increasing operating and profit margins for the past year which is evident through the layoffs that have been occuring for the company and the smart tactic of halting off employee retirement accounts in order to address short-term issues
You're maybe wondering:
"It could be because they missed on Revenues which is why they aren't seeing as much growth progress on the stock"
Nope!
Exxon has outperformed in terms of Earnings AND Revenue, for the past 2 quarters, they have beaten revenues by nearly $3 billion to $5 billion. Even back in Q1 of 2021 (February) Even they missed revenues by $1-$2 billion approximately yet the stock price rallied.
Now, it shouldn't be the case that a stock should trade at X based on earnings, but what I'm trying to say is that if the trend of beating earnings and revenue estimates continue and go on until 2022, Exxon could be fairly traded at a price of $75-$80 based on the margins, estimates, etc.
We could apply an exit multiple and, based on my spreadsheet, Exxon should be trading based on all of these multiples (Based on estimates):
2021
fair val. ev/ebitda $141.37
fair val. ev/ebit $81.25
fair val. ev/s $67.37
fair val. p/e $74.56
fair val. p/s $72.09
average $87.33
median $74.56
Also, not to mention, the average expected price for Exxon matches up by adding a 2018/2021E ratio as 2021 estimates are currently trading at nearly the exact same cash flows and EPS with EBITDA estimates matching up more than 2018 EBITDA (Except for EBIT as 2018 EBIT is higher than expected 2021 EBIT).
That's all for my analysis, for those wondering how the above calculations work, it only works on companies that do not dilute outstanding shares or buyback those same shares.
It's basically an exit multiple.
That's all, goodbye!

XOM Bull Flag brokenNow when bull flag is broken, it takes nothing more than breaking premarket high for stock to have a bull run


$XOM Bull Flag54.59 support held very well. There is very nice bull flag formed above it. Yesterday (7/26) bullish momentum started. Today (7/27) if we see momentum to the new high it means bull flag is broken and we can expect another bullish momentum.

Bullish on XOMXOM has recently bounced off of its Fibonacci support while the MACD is displaying a potential buy signal as seen by the continuous reductions in selling pressure. I am bullish on the daily time frame for a swing to 64 but as the daily plays out I want to see if the weekly MACD displays any potential buy signals.
Bullish Signals
-MACD (less selling pressure)
-B% is low
-Bounced off of Fibonacci Support

ExxonMobil - still undervaluedPrice is below its 5-year moving average
Likely, we are in a weekly third wave up.

ExxonMobil (XOM) Nice Entry Point on D1 timeframe.ExxonMobil (XOM),D1: Mirror support level + Bollinger bands + Spinning tops + Oversold

🟡 WATCHING $XOM for ENTRY TARGET @ 58.21WATCHING $XOM for ENTRY TARGET @ 58.21
I will repost when it get’s closer if it goes that way and if it makes higher highs I’ll repost with new entry.
Look to the right. ENTRY target in grey. Sell target in green. Double position target in red. That’s it. I’m starting to also add in a few support levels as well.
I’m also thinking about doing the Entry targets on YouTube instead, maybe twice a week… I think the 10 daily charts should be for new positions, targets hit, and adds…

XOM - Trend Breaking DownXOM trend breaking down here. Having tagged long term resistance price appears to have formed an initial collapsing structure that could signal the start of a bearish trend . Volume decreasing and bearish divergence also. Might open a little short on this if price bounces to recent 0.618 / 0.786 of the local sell off for good RR. Looking for an easy no heroics trade back to 0.5/ 0.618 retracement $45 POC support area . Will exit if price drifts above resistance.

As another request, my view on XOM! 👀As @tomgjuraj requested, I’ll share my view on XOM with you today!
We do have many interesting signs. We have a RSI divergence, and we are above a support area. We don’t see any buy sign, and the 20ma is a resistance, but if XOM breaks it, then we might see a rally.
XOM is pretty oversold in the 4h, and e are above the support. If it break the 20ma in the 30min, it’ll be a good sign. We are outside the BB, and if XOM closes inside it again tomorrow, I think it’ll confirm a rally, maybe to the 63. This is about 5%.
It is worth to watch these points on XOM for now and see how the price will react.
If you liked this trading idea, remember to click on the “Follow” button to get more trading ideas like this, and if you agree with me, click on the “Agree” button 😉.
See you soon,
Melissa.


Bearish divergenceAfter a huge rally ( more than 100% ), I can see a bearish divergence on MACD . So, we might see a pull back. I would take some profit here Or buy some put options.
Please note:
- I'm just sharing my view. it's not a recommendation for buying or selling.

Long | XOMNYSE:XOM
TP1: 64.80$
Call options, Strike 70$, 07/16/21
*This is my idea and could be wrong 100%
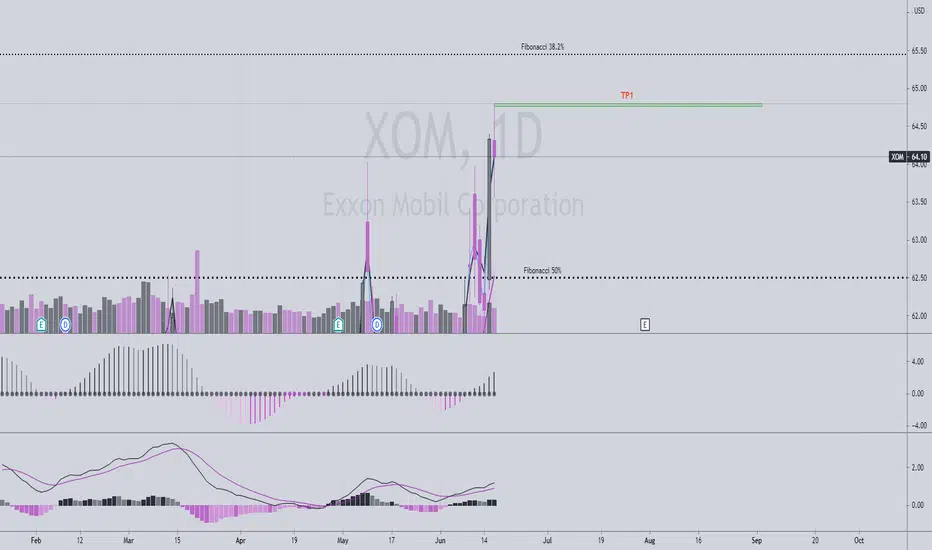
XOM64 was the entry trigger. If XOM can stay above 64, it can move up to 65.5 by the end of the week.
My current position is the 64.5C 6/18. $.46


XOM is going to XOOM (along with the entire sector)Oil plays are set up right now. Beautiful cup and handles. Bounces off the trendline and just launched off the 20 SMA. Lot's of resistance ahead, watch for a volume spike to get through. Give it some time. (3 months). Oil go Xoom.

XOM Price Target $71 by DecemberWhile the Energy sector as a whole is trending up with the rise in crude oil and the demand for it. However, until now, Exxon Mobile was under a lot of scrutiny for not embracing ESG protocols, which led to their attack from "Social-Good" Activists. This, in-turn, led to the conversion of the leadership strategy, which now prioritizes removing their carbon footprint. With that said, they have now cleared that obstacle as well as moved back to full operability.
To avoid overcomplicating things, $XOM has amazing financials, is a market mover, AND now is a favored oil firm in an incredibly booming market. They will have an amazing earnings call next session and this will propel them to the next level.
My recommendation is to add 10% of your portfolio to this firm with a 10% trailing stop loss. The price target is between $68 - $71 by end of the year.
Happy Investing!


Technical analysis update: XOM (7th June 2021)Recently RSI and MACD turned back to bullish side. At the same time ADX shows signs of revival. In addition to that oil price keeps rising. We think that XOM will continue its rise above 1st resistance at 62.55 USD. XOM currently provides very interesting setup. Our short term price target for XOM is 62. 50 USD and our medium term price target is 65 USD.
Here is setup from 8th May 2021:
It is very similar to the current setup.
Disclaimer: This analysis is not intended to encourage buying or selling of any particular securities. Furthermore, it should not serve as basis for taking any trade action by individual investor. Your own due dilligence is highly advised before entering trade.

$XOM Exxon Mobil. Cup and handle - BullishExxon Mobil is build a bullish looking cup and handle. A break of the neckline would open a $70 price target.
I have a position