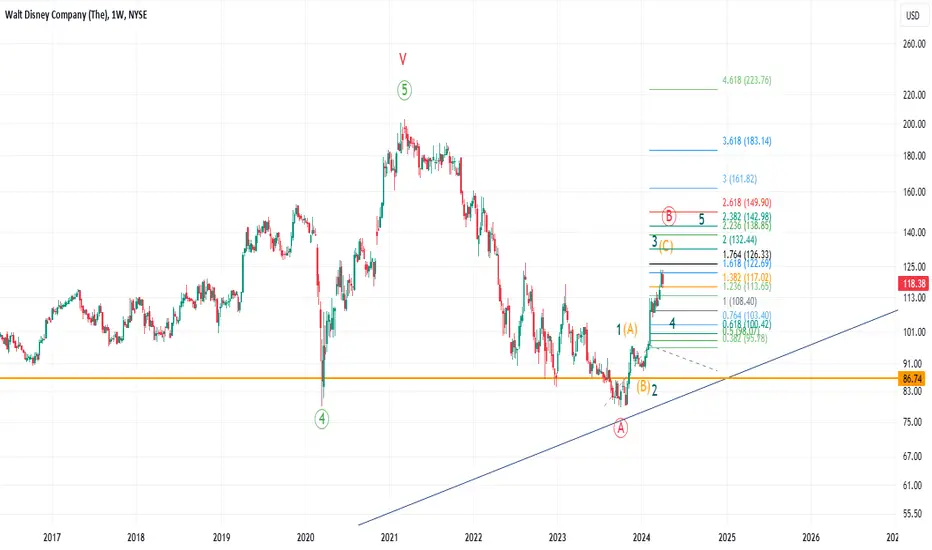
Mickey Mouse back to $88?I can see Disney pulling back to support (upper line of parallel channel) creating confluence with the .236 fib.
Wouldn't play this short but would 100% take a long at around that price range ($88-$90).
77820.00
0.00BRL
11.93 BBRL
448.43 BBRL
About WALT DISNEY DRN
Sector
Industry
CEO
Robert A. Iger
Website
Headquarters
Burbank
Employees (FY)
225 K
Founded
1923
ISIN
BRDISBBDR006
FIGI
BBG0025NPP60
The Walt Disney Co. engages in the business of international family entertainment and media enterprise. It owns and operates television and radio production, distribution and broadcasting stations, direct-to-consumer services, amusement parks, and hotels. It operates through the following business segments: Disney Entertainment, ESPN, and Disney Parks, Experiences, and Products. The company was founded by Walter Elias Disney on October 16, 1923 and is headquartered in Burbank, CA.

Understanding Market Structure In 5 MinutesThis video goes into depth on the types of market structures and how they happen. Ranging -> Breakout (Spike) -> Channel (trend or a ranging trend) -> Climax. The market moves in these repeatable patterns over and over and over again. If you can diagnose where we are in these cycles then you can har

Is Disney's Renaissance Sustainable?In the annals of financial lore, few sagas are as captivating as the rollercoaster ride of Disney's stock. From the dizzying heights of its peak to the depths of its nadir, the House of Mouse has seen it all. Yet, just as a phoenix rises from the ashes, so too has Disney experienced a remarkable res

DISNEY $DIS | DISNEY DESCENDING TRIANGLE PATTERN - Apr. 11, 2024DISNEY NYSE:DIS | DISNEY DESCENDING TRIANGLE PATTERN - Apr. 11, 2024
BUY/LONG ZONE (GREEN): $118.50 - $123.00
DO NOT TRADE/DNT ZONE (WHITE): $116.50 - $118.50
SELL/SHORT ZONE (RED): $112.00 - $116.50
Weekly: Bullish
Daily: DNT
4H: Bearish
A week ago NYSE:DIS broke its bullish trend on the 4H

$DIS Disney Long term bottomWe see rounding capitulation, possibly signalling the first 1/3rd of a cup and handle.
If we look in the bottom volume pane we see the point of engulphment; see X (circled blue)
STATEMENTS//
*DISNEY 1Q REV. $23.55B, EST. $23.8B ( MISS ❌ )
*DISNEY 1Q ADJ EPS $1.22, EST. 99C ( BEAT ✅ )
*DISNEY 1

$DIS-Walt Disney could dive further after breaking $111NYSE:DIS -Walt Disney could dive further after breaking $111
It looks like the DIS broke out of a major support zone located near $111.
On the 4 hour chart we can expect a deeper correction as a swing trade.
If we also consider the daily time frame a major resistance zone was already tested. This

$DIS Hanging onto the 50 DMANYSE:DIS I have taken a long position here as DIS seems to be holding the 50 DMA (red). My stop is nearby, just below the low on April 16th. This is a very early entry as it is below the 8 and 21 EMA but just reclaimed the 5 DMA (white).
The chart I am using is the All-In-One LevelUp tool availabl

Walt Disney UpdateIf the price comes back to 107 price level support and has bullish signs, I might want to add a bit more into this company.

Disney Rejected 38.2% Fibo but Upside IntactStratos Markets Limited (www.fxcm.com):
CFDs are complex instruments and come with a high risk of losing money rapidly due to leverage. 66% of retail investor accounts lose money when trading CFDs with this provider. You should consider whether you understand how CFDs work and whether you can affo

DIS: 3 waves move so farLast week's huge reversal candle most likely ended the bull run that started in January. There is a chance that proce will move sideways in a range for a few days and then make another peak above $124, but still it will be a 3 waves moves. So what does that put the current price action relative to t
See all ideas
Trade directly on the supercharts through our supported, fully-verified and user-reviewed brokers.


Curated watchlists where DISB34 is featured.


