disney--> time to get outDisney is showing bearish divergence. If there is bearish engulfing on weekly then it can go down
hope you are enjoying my analysis, ideas here are for entertainment and education these are not trading advice
DISB34 trade ideas

DIS - updated idea Wave 4 (blue) might ended on 21 Apr and wave 5 impulse upward might be underway.
Confirm wave 5 once price above190.40.
First target : 200.60 (recent high )

Traditional|DIS|Long and shortLong and short DIS
Activation of the transaction only when the blue zone is fixed/broken.
The author recommends the use of anchoring fixed the blue zone, this variation is less risky.
If there is increased volatility in the market and the price is held for more than 2-3 minutes behind the activation zone after the breakdown, then the activation of the idea occurs at the prices behind the activation zone.
Working out the support and resistance levels of the consolidation zone.
* Possible closing of a trade before reaching the take/stop zone. The author can close the deal for subjective reasons, this does not completely cancel the idea and is not a call to the same action, you can continue working out the idea according to your data, but without the support of the author.
+ ! - zone highlighted by the ellipse is a zone of increased resistance, in this area there is a possible reversal for a correction, please take this factor into account in this transaction.
The "forecast" tool is used for more noticeable display of % (for the place of the usual % scale) of the price change, I do not put the date and time of the transaction, only %.
The breakdown of the upper blue zone - long.
Breakdown of the lower blue zone - short.
Working out the stop when the price returns to the level after activation + fixing in the red zone.
Blue zones - activation zones.
Green zone - take zone.
Red zone - stop zone.
Orange arrows indicate the direction of the take.
Red arrows indicate the direction of the stop.
Priority - The value of the priority parameter implies the author's subjective opinion about the more likely activation zone on this idea, this does not mean that this idea will be 80% activated by this parameter, the purpose of the parameter is to provide for the risk of the inverse of the zone parameter.
Example: "Priority Long: So the author inclines more in the direction of the activation zone open long trades, in this case, when reaching the activation zone in short you should be very careful, because this area may be highly likely to be punched about the breakdown/do not get to take/activate transaction from go to stop."
Please consider this parameter if you use my ideas.
SUM PNL: This parameter displays the total % of all closed ideas of the "new" format (according to the author) for this sector at the time of publication of the idea. The calculation is very "clumsy" just the sum of the profits of all the ideas, based on this indicator, you can more accurately assess the risks when working with my ideas of this sector. I present you the construction of the idea, you can use it yourself as you like based on your subjective view and risks, the calculation of the PNL indicator is carried out only on transactions that the author closed on TV in manual mode or by take.
P.S Please use RM (risk management) and MM (money management) if you decide to use my ideas, there will always be unprofitable ideas, this will definitely happen, the goal of the system is that there will be more profitable ideas at a distance.

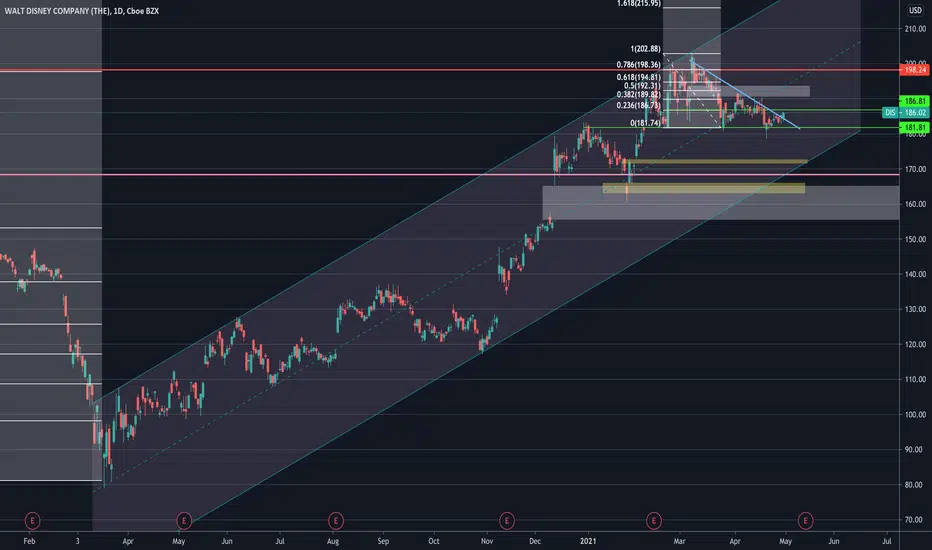


Analyzing the current situation on Disney (DIS)Today, we will take a look at the DIS chart:
A) The price is above a broken ascending channel which tells us about a bullish trend that has been accelerating
B) Finding Support on the cloned channel, we can see a clear corrective pattern (yellow lines)
C) From a Technical Perspective, this type of structure after the breakout tends to show continuation movements as the previous impulse.
D) The horizontal line is the activation level in which we consider our Analysis is active
E) We are using Fibo extensions to get an idea of possible Targets
F) The invalidation level is below the corrective structure.


Hold on !DIS is still involved in a pullback.
Price action records new lows and is unable to move to new highs.
The trendline works as resistance.
EMAS are pointing down and work as resistance as well.
I'd like to see a test of EMA 21 Weekly to try a Swing

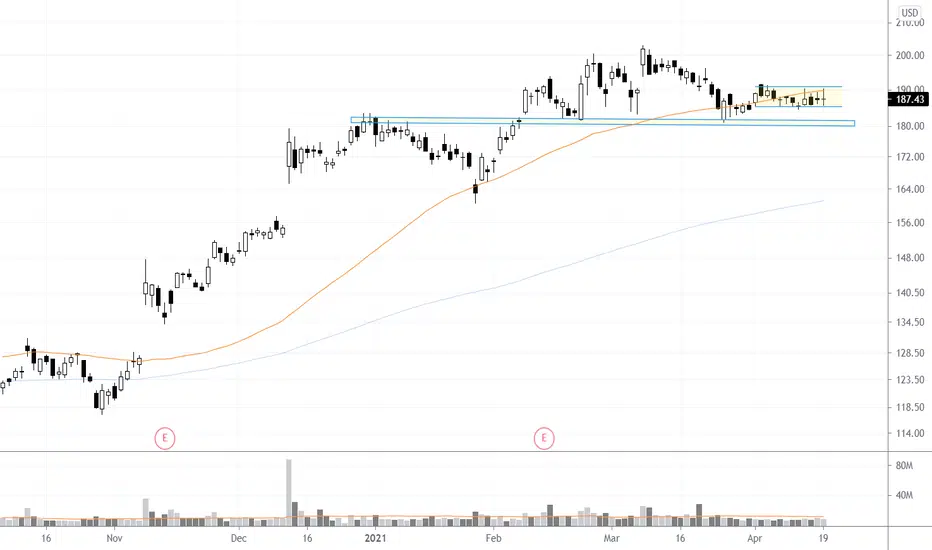
Disney is consolidatingDisney is forming an accumulation pattern, Support level has been tested in the past 4 times.
Target price: 200


MATRIX portfolio DIS/USD : Smart-money levels No description needed.
I just spot where the value should be or where are the levels smart-money and institutionals traders and investors look for buy entry's, according to Fibonacci retracements.
NOT FINANCIAL ADVICE
MORPHEUS.


$DIS Tight Range SetupDisney continue to hold its support level and has now traded in a very tight range for the last 2 weeks. A good entry trigger is a daily close back above $191 area.
Analyse de WDPCe marché est dans une zone d'équilibre après avoir cassé un support, nous ne prendrons aucune position. s'il dépasse le niveau 159.00 nous achetons ou le niveau 154.62 nous vendons.
This market is in an equilibrium zone after breaking a support, we will not take any position. if it goes above the 159.00 level we buy or the 154.62 level we sell.

$DIS set to break out!!! where the volume??$DIS has made new lower highs and has been maintaining support at 185.21, the pattern it has made is a pennant. The RSI posture is rulered upward suggestion BULL. The stochastics moving averages are crossing and becoming more erect, which suggest continuation to the upside. The sniper indicators last given signal was a bull one, overall I feel we still need volume to break out. Overall I'm bullish, I see momentum getting tighter as it wedges into the pennant, which is usually followed by a pop in either direction based on the indicators and price action I say itlll be to the upside.

DIS Analysis $DIS | #Analysis | #StockMarket
Price Target 209.50 🎯
Trend Break + Backtest ✅
Higher Lows with Break Above Clouds ✅
3 Rejections of 50EMA with RSI Curling Up ✅
Entry on Break of 190.40 with Confirmation ✅
Invalidated below 182.72 ❌


DIS Long Option Hopped into Oct $185 calls here.
Price retraced perfectly to the 50% Fib line, and is now holding the .382
With a bullish market and top tier stock beaten down a bit from its last impulse I'm looking for a run up into earnings.
I'll be looking to sell at a $200 or 10/20% option gain (whichever comes first).

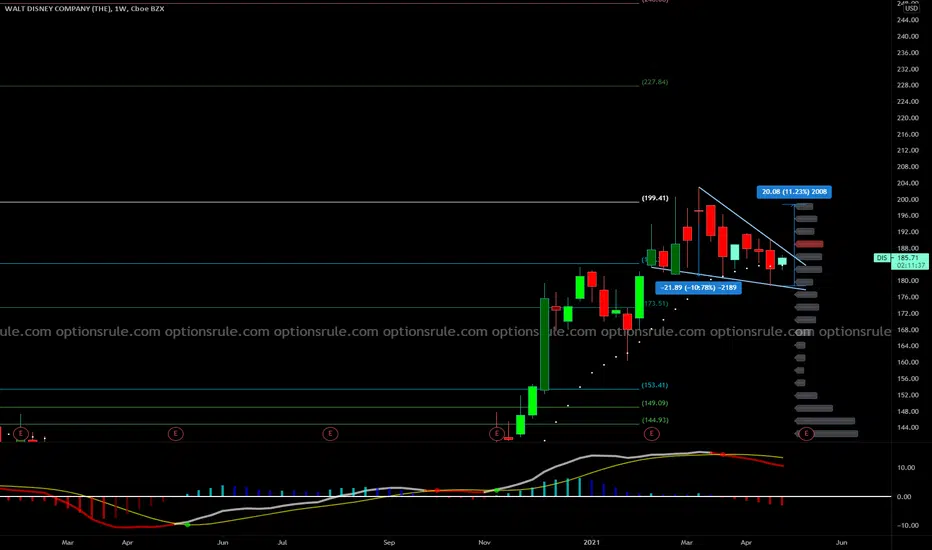
DIS WEEKLY
BEARISH Deep Crab
price need to follow Green Trend line & hit target
If price Breaks Red Trend line is where EXIT before SL hits
POTENTIAL SELL

