F1TN34 trade ideas


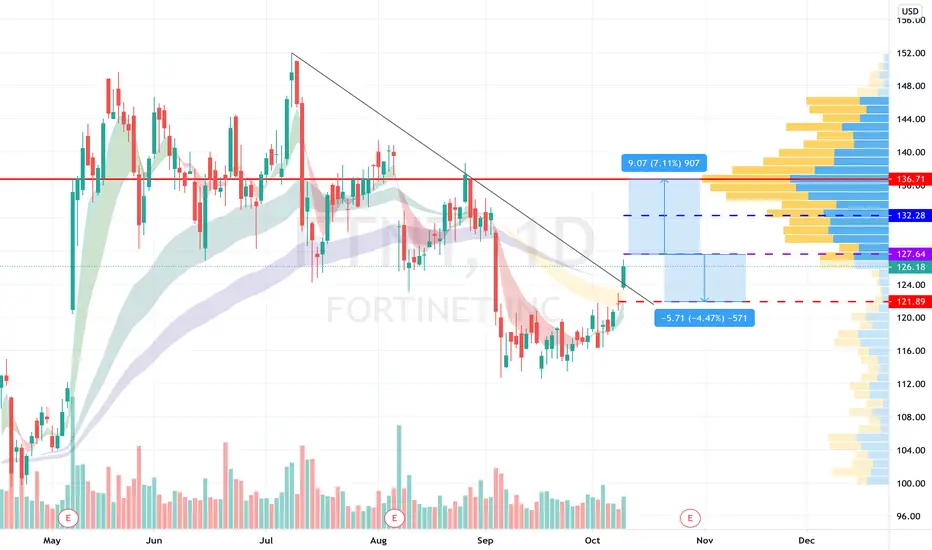
Spinning Top pattern (short opportunity)Playing game is enough get ready to go back to business..!
Potential price drop: 10%
Reward/Risk:5
Timeframe: 1-2 months
I always try to present the charts in a simple comprehensive format to prevent any confusion.
This is just my technical view, neither a fundamental comment,nor a recommendation to trade..!
Please review my track record and calculate the odds for yourself..!
You’re likes and comments encourage me to continue this.
Stay tuned great live stream and quality content videos coming soon..!

Will FTNT drop over next week?FTNT has been charging hard this month, but a cooling off period may be in front of us. Six of my algorithms triggered a SELL at the close of the opening bar yesterday. All six signals have never simultaneously signaled SELL at the same time. The last time Algorithm 2 (Buy-Sell-Now-v2) signaled on the FTNT 3 hour chart was 2010.
Like most of my algorithms, they do not identify immediate price reversal. In the current case, the expected delay is between 3 and 4 bars after the signal from yesterday. This means we could see a near-term top this morning. There are two major pockets of tops my programs have found. Even though these are confluence areas, the tops could occur at other price levels.
Pocket 1 is around 171.00 and the second area is around 171.60. After the initial moves up, I am looking at a decline over the next week. A majority of the modeled declines have the bottom around March 1 (in fact most are pointing to the first 3 hours of March 1). There are also two target price pockets for this decline. A majority are around 163.00 and the other is 160.30.
The full analysis and statistics are available for free on my website as usual. Let me know what you think and thanks for reading.

$FTNT with a bullish outlook following its earnings #BeststocksThe PEAD projected a bullish outlook for $FTNT after a positive over reaction after its earnings release placing the stock in drift B
If you would like to see the Drift for another stock please message us. Also click on the Like Button if this was useful and follow us or join us.

Cup and HandleFTNT fell from a rising wedge for a few days, but did not fall far.
Bearish Divergence on RSI noted..
Candles look bullish..
NV and obv are high/Short interest is low..
Mixed messages on this one..not a recommendation..
Everything is easier when you are looking through the rear view mirror (o:

$FTNT Bullish patternLet's take a look at NASDAQ:FTNT :
1) $FTNT has been continuously growing it's earning/EPS since April 2018.
2) It has been consolidating for a long time now.
3) It is in a bullish triangle formation.
4) Stochastic indicators are showing hidden bullish divergence.
5) It may be getting ready to take-off !!

$FTNT TO RISE TO A NEW ATHAccording to technicals as shown Fortinet Inc. is about to make more gains as the price has broken through an ascending triangle.
The target is expected to be around $195.
Not a financial advice. Make your own research before getting in. Trade safe and have a nice day.


FTNTPotential cup & handle in the making? Still like this name. No clue if it'll consolidate or just keep running in this crazy market.

Fortinet: next level in 184$
Here we have Fortinet stock that wants to climb to 184$. Fibonacci retracement bounces at level 61,8% expecting to achieve that goal I mentioned earlier. It's likely that it will get it next month.

FTNTSolid run so far. Took some off into the 2.618 retracement Friday. Looking for a little consolidation then continuation to $172


Fortinet.w48 2020. Wait for momentum. Open 95Monthly
Strong uptrend
Volatile
Divergency = overheated.
Weekly
Downtrend
Strong Sellers = not a good time to open
Daily
I recommend wait and better buy from SR level ( 93-95
OPEN 95
SL 86
TP 140
RR 3.5

Bull and bear cases To go long: I would want to see it first over this trend line, then over the major (march low to recent high) .786 fib, then preferably over the VPOC in red and .618 minor fib (Recent high to low) in black. The alternate bull case is a cup and handle with a run into earnings, bullish accumulation/distribution as shown below.

FTNT, not even spectacular earnings can save stocksGot burned on this last quarter so stayed out.
Beat big on both top and bottom lines plus great guidance. Got hammered anyways today. It was actually sitting a pre-COVID level too.
Trailing P/E now 36, forward P/E around 30....
Not touching this unless it hits $70 again, which would be ridiculous, but I've seen the market do dumber things. I think it just goes sideways again like last earnings. Another buy indicator is daily RSI hitting oversold twice.....

FTNT: Cup & Handle formingToday I opened two positions after recognising the huge cup and the beginning of the handle.
Still working on my trading strategy targeting this pattern.
Safest bet is to enter when the SP breaks the upper cup line, in this case I decided to enter early because the support @128 did not break.
Currently my SL is sitting at the 50% mark of the cup raise. If this breaks the pattern is invalidated.
As soon as the price breaks and closes on the daily above the cup @133.26 I will adjust the SL to the upper third of the cup raise (where depends how it moves within the handle).
The move from the bottom to the top of the cup measures in $ 20.63. So we can expect a similar move when it breaks out which makes a target @153.89
But I also take the trend based fib levels 1 (147.68) and 1.618 (160.6) into account. The second one might be a target in a follow up trade.
Entry: 129.04
TP1: 147.68
TP2: 153.89
SL: 123.29
Not sure, but this might also lead to an inverse h&s.

Earnings (FTNT)Finally figured out what's going on in this crazy market, a lot of stocks are headed back to where they were last quarter right after earnings... like a day or two after earnings
FTNT, DLTR, AMZN, FB, LPSN, WDAY, SHOP, OSTK, BLDP etc
Notable exceptions being stocks that have extremely high growth like ZM and PTON. Also, stocks that split are higher like AAPL and TSLA.
Not expecting the market to do much next week aside from earnings

Solid r/r for this cloud security nameClear path up to the VPOC which aligns with a fib, stop loss at the fib below
Rising Wedge Falling WedgeFTNT fell from a large rising wedge pattern. Did not meet cup and handle targets.
In a falling wedge at this time. Falling wedges can be bullish at the bottom and signal reversal in trend. A stock must break from the falling wedge in a clear uptrend, but this is not exactly the bottom.
There is a gap right under 89ish which would be the last line of support
I am hoping it doesnt go that low...but it is an unfilled gap )o: There are several support areas before that..so maybe FTNT will land soon
Not a recommendation

Fortinet at important supportWe are seeing confluence of support around $120 approximately.
Test 1: February high
Test 2: Bottom of gap
Test 3: 200sma
Risk Reward ratio is great, as we can set a stop below the 200sma.
RSI is still not oversold on such a drastic down movement.
