RTX Bollinger Band SqueezeRTX has recently bounce off it uptrending support and has been more or less consolidating. Through the consolidation the bollinger bands have been contracting tighter, this is showing there to be a soon breakout. This breakout may come before earnings up to the 68 range.
RYTT34 trade ideas


RTX With a price target of $77, RTX has a hurdle to cross during the earnings season. Indicators are telling a buy with decent symmetry. Earnings season is near, and will the company C4ISR contracts pull it over the hurdle....

RTX - Broke Supporting Trendbroke support trend, Fib levels has potential to $53 or lower. RSI still neutral, MACD cross recently too

RTXCouple bearish patterns here triggered on the $62.00-$62.50 break. Head & shoulders on daily. 3 bar play on weekly. Pink line is target.

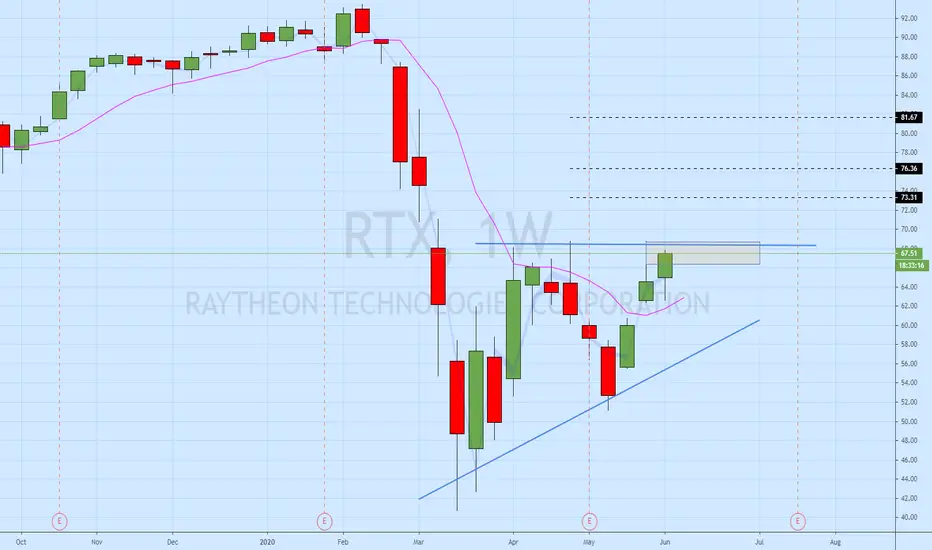
A triple Bull clawThe decline slopes are decreasing in downward slope angle. Sentiment in selling off fast is decreasing. Two directions fill up the gap at 50-55 or trend back up in the channel. I predict that it will trend inside the channel due to all the contracts being awarded and that we will get out of this pandemic in a better position. Plus people invest forward looking.


$RTX - bounce after H/S$RTX
Target short was 58.
Bounced at $59
Gap filled back to $62.89
Bottom support now is $60.02 for a potential long idea

RTX entry Elliot wave jump possible Looking like it could be a decent look for RTX before earnings. Many deals...big deals in the C4ISR realm for Pentagon.

RTX - This big guy seems falling hardNow, decided to write cash and considering it again around end of July

short after confirmation of H&SThe price is forming a very well know reversal pattern, Head and Shoulders (H&S), and after the confirmation of braking the neckline of 61 usd, the price may go down to 50-52 usd, fill in the gap at 52 usd from the first week of April.
Stay safe!

ShortRaytheon just broke through a Head and Shoulder formation. When the stock price reaches 63.65USD again the price might drop even further. And you would have a good Chance/Risk ratio.

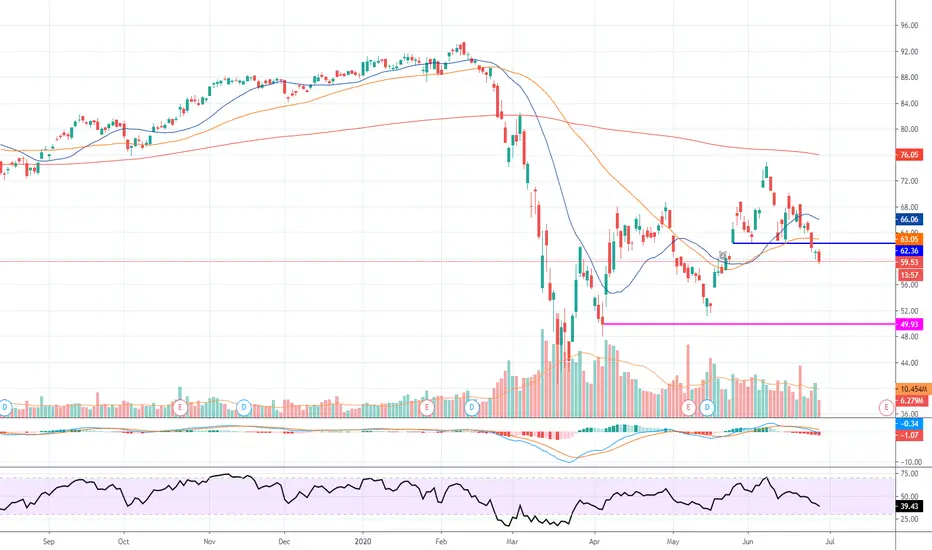
RTX Quick Short62.36 is the support from 5/26.
If it drops past there isn't much support until 60.
We've opened a short to play this gap.
The sell volume has also been decent these past few weeks which makes confident the decline is sustainable.

RTX Bullish Cypher, Dave Portnoy is early! I seen the executive president of DDTG global global global grab some RTX so I checked the chart. Thought I spotted a bullish cypher, and measurements line up.
I think Davey is a little early on the long. My play will be a scalp short of the break of (B) for a position reverse at the multi level confluence (D) point (entry long). Typically the take profit long would be C to D retrace of .382 and .618, but I will leave half on for trend continuation higher.

$RTX -- H/S$RTX I want to be bullish because of all the military chatter happening with china and the middle east. Watching the potential H/S pattern on this tho.


RTX SHORT PLAYSharing my RTX short play for the week and possible entry for Long play. Any feedback would be awesome. Mahalo
I do like RTX as a long play as well after merging with united technologies. The products they provide in aerospace, drones and defense systems will play a role in the future imo.
beat earnings last 4 quarters
est eps for Q2 2020 much lower @ .36 (expected)
increased Revenue over past 4 years
government funded ?
Balance sheet looks ok I think. Still new to understanding how many zeros to add.


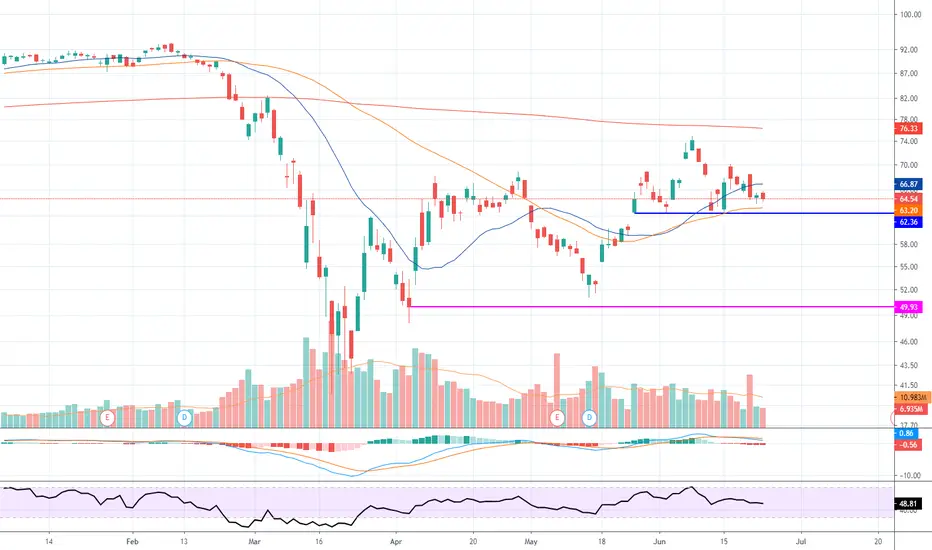
RTX TA Here is my technical analysis for Raytheon Technologies. It is currently in a wedge and looking for a breakout. We could either have the break above $69.00 to the upside to test the resistance of 71.76 or the rejection of the wedge and a break down to the next critical level of support at $62.08.

Decent 50% fib spreadgravestone doji possible price pressure, BUT 50% fib possible upside move and flag breakout near consolidation.
