Amazon Either OrLooking at potential long and shorts for Amazon, Long from just above 80 and short from just below 100
AMZN trade ideas

January Gainers (AMZN, account up 0.5%)1st gainer in January is AMZN. Holding period is 6 days (12/28/22-1/3/23). Account up 0.5%.
This month till today, my account is up 0.5%, average holding period is 6 days.
My trading method is mostly short term and is independent of market swings.
Will keep updating on my trades.

$AMZN LongPrice at apex of huge falling wedge and major support level from March '20.
Confirmed bullish divergence on daily with developing bullish divergence on weekly chart.
5.5 R:R. Tight stop loss below recent lows.

Amazon short-termAmazon Target on short terms :
Support :79-81
Target 1 :86-87
Target 2: 92-93
not financial advice.

Amazon 20% Channel!!A solid move up could make you 20% if all goes according to plan.
Love it or hate it, hit that thumbs up and share your thoughts below!
Every day the charts provide new information. You have to adjust or get REKT.
Don't trade with what you're not willing to lose. Safe Trading, Calculate Your Risk/Reward & Collect!
This is not financial advice. This is for educational purposes only.

Did Someone Say SUPPORT ZONE!?!Amazon is currently at support and there is a higher probability price moves up from here...
Love it or hate it, hit that thumbs up and share your thoughts below!
Every day the charts provide new information. You have to adjust or get REKT.
Don't trade with what you're not willing to lose. Safe Trading, Calculate Your Risk/Reward & Collect!
This is not financial advice. This is for educational purposes only.


Will AMZN's Primary Downtrend Break Its Secular Uptrend?Primary Chart: Primary Down Trendline from 2021, Secular Up Trendline from 1997, Long-Term Up TL from 2008 GFC Low, and Fibonacci Retracements from Covid 2020 Low
Summary:
1. This post provides a broader view of the technical environment within which AMZN's day-to-day price action takes place.
2. AMZN remains within a primary downtrend (see the parallel channel from the all-time highs). But it remains within a secular uptrend, and has tagged and remains near the secular up trendline from 1997. Such long-term trendlines could be drawn perhaps a bit higher or lower. SquishTrade drew it conservatively as possible from the bearish perspective. If the trendline were moved slightly higher, given its length, such a slight move results in a fairly large change in the current level. This is like adjusting an arrow slightly after it leaves a bow, and over time, a slight adjustment makes a huge difference in the destination.
3. Being within a primary downtrend but nearing a secular uptrend makes trades more tricky perhaps as the uptrend line is neared. But until the primary downtrend structure changes, SquishTrade favors a break of the 1997 up trendline after some messy whipsaws perhaps. The 14-year 2008 upward trendline broke earlier this year, although it was retested several times with some whipsaws as well.
4. A break of the secular up trendline puts Covid lows, coinciding with a Fibonacci levels, in play as a target. These lows and the Fibonacci levels range from $78 to $82. If the downward trendline breaks, SquishTrade forecasts that price will likely reach this range within 2 to 4 months (March 2023 at the latest).
5. A more aggressive target range lies at $64 to $67.
6. In the very short-term, it appears that a bounce is imminent, and this bounce may be sold before it reaches the most recent swing high. But this will be covered in a separate post to be published soon.
The Primary Chart shows AMZN's downtrend at the primary degree of trend. This is represented by a parallel channel on a logarithmic chart. A parallel channel on this weekly chart comprises both a down trendline across the material highs and a return line across the material lows.
This downtrend broke below the upward TL from the 2008 GFC low. That TL was retested several times after it was broken. Major long-term support and resistance levels are not broken easily, and often require more than one attempt. As the price action around this 2008 trendline illustrates, price may often retest or whipsaw around longer-term trendlines or longer-term levels.
In any event, this chart helps to keep AMZN trading in context. In the event a bearish flush takes place, check out the long-term secular uptrend line from 1997. Below is a broader view (zoomed out) of both the 2008 and the 1997 trendlines, combined with the current one-year down trendline from all-time highs:
Supplementary Chart A: Monthly Chart of AMZN's Long-Term Trendlines
Such long-term trendlines as the 1997 up trendline could be drawn perhaps a bit higher or lower. SquishTrade drew it conservatively as possible from a bearish perspective. If the trendline were moved slightly higher, given its length, such a slight move results in a fairly large change in the current level. This is like adjusting an arrow slightly after it leaves a bow, and over time, a slight adjustment makes a huge difference in the destination.
In short, AMZN is trading within a primary downtrend but also nearing a secular uptrend, and this makes trading, investing and forecasting more tricky as the secular uptrend line is neared. But until the primary downtrend structure changes, SquishTrade favors a break of the 1997 secular upward trendline after some messy whipsaws perhaps. The 14-year 2008 upward trendline broke earlier this year, although it was retested several times with some whipsaws as well.
A break of the secular up trendline puts Covid lows, coinciding with a Fibonacci levels, in play as a target. These lows and the Fibonacci levels range from $78 to $82. If the downward trendline breaks, SquishTrade forecasts that price will likely reach this range within 2 to 4 months (March 2023 at the latest). A more aggressive target range lies at $64 to $67. RSI on a daily chart shows that lower prices should be expected. Consider that momentum has remained in a downtrend as well for a while:
Supplementary Chart B: AMZN's RSI (Daily) in a Downtrend
Price could pause at the secular uptrend line, break below and whipsaw back above, or do a series of whipsaws above and below before choosing a direction. A good example of how price can whipsaw above and below a long-term trendline is seen on Apple's chart here . Over the past several weeks, AAPL has whipsawed above and below the line about seven times. That doesn't have to happen every time, but it should not be expected that price will slice through such key trendlines (assuming correctly drawn) like a hot knife through butter with no hesitation and no looking back.
In any case, the main argument here is that the primary downtrend must continue to be respected, especially when AMZN remains below the .618 and .50 Fibonacci retracements of its rally from December 2018 lows to November 2021 highs. The .618 retracement lies at $97.98, and the .50 retracement lies at $111.03. So the intermediate term forecast (2-4 months) is for price to continue trending lower to about the March 2020 pandemic lows and perhaps to the Fibonacci 1.00 projection area at $78, acknowledging that this move will not be in a straight line and that downtrends include highs—albeit lower ones at the degree of trend where the downtrend exists. But the secular uptrend from 1997 should be carefully watched. Shorts at this level are higher risk than shorts taken above the level, depending on the trading time frame.
This post is not exactly a trade idea, although it does forecast lower prices with some targets over the coming weeks and months. Rather, it attempts to provide a broader view of the technical environment within which AMZN's daily price action occurs. It's not quite as straightforward as the primary downtrend (yellow parallel channel) might suggest. In any event, seeing the longer-term view may help those who may approach AMZN with both short-term and long-term trading and investing plans.
Within the next few days, another short-term post will accompany this one with a short-term outlook (several days to a couple weeks).
________________________________________
Author's Comment: Thank you for reviewing this post and considering its charts and analysis. The author welcomes comments, discussion and debate (respectfully presented) in the comment section. Shared charts are especially helpful to support any opposing or alternative view. This article is intended to present an unbiased, technical view of the security or tradable risk asset discussed.
Please note further that this technical-analysis viewpoint is short-term in nature. This is not a trade recommendation but a technical-analysis overview and commentary with levels to watch for the near term. This technical-analysis viewpoint could change at a moment's notice should price move beyond a level of invalidation. Further, proper risk-management techniques are vital to trading success. And countertrend or mean-reversion trading, e.g., trading a rally in a bear market, is lower probability and is tricky and challenging even for the most experienced traders.
DISCLAIMER: This post contains commentary published solely for educational and informational purposes. This post's content (and any content available through links in this post) and its views do not constitute financial advice or an investment or trading recommendation, and they do not account for readers' personal financial circumstances, or their investing or trading objectives, time frame, and risk tolerance. Readers should perform their own due diligence, and consult a qualified financial adviser or other investment / financial professional before entering any trade, investment or other transaction.

AMZN: Waiting for a Juicy Little BouncePrimary Chart: AMZN's Primary Downtrend with Parallel Channel, Daily 8 and 21 EMAs, Fibonacci Levels
Summary:
1. SquishTrade's longer-term view is bearish. In the short-term, prices could bounce to retrace the first wave of decline from the November 15 high at $103.79.
2. Short-term bounce targets are $100. After the bounce reverses lower, downside price targets are $78-$82.
3. The existence of a primary downtrend suggests probabilities favor more weakness ahead despite any bounces that may occur into early December or year end. But the existence of a secular uptrend suggests that prices could behave in a more complex manner, whipsawing around the secular uptrend, or even surprising to the upside for a while given the length, and therefore strength, of this very long term trendline. So be ready for anything.
4. Reacting with flexibility to the levels and the technical patterns is a better approach than blindly relying on a forecast, even if the forecast is well reasoned, and even if it was produced by some sort of expert.
SquishTrade is waiting for a juicy little bounce in AMZN. That bounce may help determine whether the corrective rally off the YTD lows is finished.
At the outset, SquishTrade holds a longer-term bearish view on AMZN. Please see the technical basis for this bearish view in the chart and post below. This longer-term view is slightly complicated by the fact that the primary trend (over the past year) is on a collision course with a 25-year secular uptrend.
Supplementary Chart A
In the short-term, an imminent bounce looks possible. A falling wedge pattern, shown below in Supplementary Chart B, typically provides a bullish signal. But if it breaks bearishly, that would be more damaging and bearish, more surprising and unexpected, potentially causing a steeper than normal selloff. This is because the pattern catches market participants off guard by breaking in the opposite direction from what is expected.
Supplementary Chart B
To determine whether the corrective rally off the YTD low is finished, evaluate any near-term bounces and whether they remain below the November 15 peak at $103.79. Any short positions should be entered with key risk levels defined, and if a short were entered around $99-$102, the November 15 high at $103.79 might be an excellent invalidation point—depending of course on the risk tolearance, overall trading approach, and position size (position size is integrally related to the stop or invalidation level). Here is an intraday chart showing a hypothetical illustration showing one way this bounce could unfold as a short setup:
Supplementary Chart C
If the bounce reverses underneath the November 15 high and shows confirmation of the next leg down, then a reasonable target lies at the $78-$82 range. This is support at the lower edge of the parallel channel as well as an area with key Fibonacci projection targets and the 25-year secular uptrend (depending when exactly the next leg down occurs, as that 25-year trendline's slope causes the support level to rise over time).
If the bounce takes out the November 15 high at $103.79, however, then the corrective rally has not completed. In this case, the corrective bounce off the lows may have further to run before AMZN likely reverses back lower. If the November 15, 2022, highs are taken, consider the upper Fibonacci clusters (the higher yellow circle on the Primary Chart) where price may chose to reverse lower. This level is at $112-$113.
In short, SquishTrade favors AMZN to go lower to $78 to $82 within the next couple months. The main forecast is lower over time. The short-term forecast is potentially higher in a bounce first. The bounce could run to upper 90s or even $100 in one scenario. Or the bounce could run to key Fibonacci levels at $112-$113 if the so-called Santa Rally materializes in December 2022.
Bold predictions abound on social media for markets and stocks and cryptos. Many like to call the bottom repeatedly as prices continue to fall. Some like to call for much lower lows for years into the future. Both are possible, and it's possible no one is right if price just chops sideways for years.
And the reality is that no one can actually predict the future with any certainty. Technical analysis is about knowing the patterns, seeing the levels and reacting to the way price unfolds when it encounters and responds to these patterns / levels. It helps to remain open and flexible to any outcome rather than reliant on a third-party forecast regardless whether its well reasoned and supported by complex cycles or De-Mark signals, and regardless whether every single Elliott Wave has been carefully labeled.
Thanks for reading. Let me know what you think too.
________________________________________
Author's Comment: Thank you for reviewing this post and considering its charts and analysis. The author welcomes comments, discussion and debate (respectfully presented) in the comment section. Shared charts are especially helpful to support any opposing or alternative view. This article is intended to present an unbiased, technical view of the security or tradable risk asset discussed.
Please note further that this technical-analysis viewpoint is short-term in nature. This is not a trade recommendation but a technical-analysis overview and commentary with levels to watch for the near term. This technical-analysis viewpoint could change at a moment's notice should price move beyond a level of invalidation. Further, proper risk-management techniques are vital to trading success. And countertrend or mean-reversion trading, e.g., trading a rally in a bear market, is lower probability and is tricky and challenging even for the most experienced traders.
DISCLAIMER: This post contains commentary published solely for educational and informational purposes. This post's content (and any content available through links in this post) and its views do not constitute financial advice or an investment or trading recommendation, and they do not account for readers' personal financial circumstances, or their investing or trading objectives, time frame, and risk tolerance. Readers should perform their own due diligence, and consult a qualified financial adviser or other investment / financial professional before entering any trade, investment or other transaction.

Amazon is bound to go lowerIf there is one company that flourished by government Covid policy, lockdowns, support packages and "free" money, it`s Amazon. Now that interest rates rise, the quantitative easing slows down and loans will be more expensive, we see an overall drop in stock prices, especially in the tech sector which stocks has been manipulated most under central bank policy, in my opinion when looking at all these tech stocks the bottom is far from in.
The Amazon chart is showing us very clear where we are going with it`s ascending broadening wedge that has broken out on the downside. Next to all those factors named before, people had more money to spend and more interest in goods during covid lockdowns, there will be less requests for goods this year, throw in an upcoming recession and big warehouse stock caused by the fear of future supply chain problems and we will see prices between $65 / $57 per share.

$AMZN DESCENDING WEDGEDescending wedge. Watching for an upwards break which is highly likely to happen. All tech should get a bounce in that event. Watching closely


AMZN: Moving into A Buy Zone?The Weekly Chart of AMZN shows that the stock has dropped into a strong support price level with a risk that there could be a Dark Pool Buy Zone here. The share price is now below fundamental values.
With a month before AMZN reports earnings, it will be interesting to see how the stock behaves; it will reveal how well AMZN is recovering from the hyper revenues created by the stay-at-home orders and stimulus checks of the pandemic. This is the last quarterly report that will be skewed with the revenues and earnings from the pandemic anomaly.
This company MUST provide a dividend soon.


AMZN Potential for Bearish Continuation | 3rd January 2023Looking at the H4 chart, my overall bias for AMZN is bearish due to the current price being below the Ichimoku cloud , indicating a bearish market. Looking for a sell entry at 85.88, where the previous low is. Stop loss will be at 103.78, where the recent high is. Take profit will be at 69.43, where the -27.2% Fibonacci expansion line is.
Any opinions, news, research, analyses, prices, other information, or links to third-party sites contained on this website are provided on an "as-is" basis, as general market commentary, and do not constitute investment advice. The market commentary has not been prepared in accordance with legal requirements designed to promote the independence of investment research, and it is therefore not subject to any prohibition on dealing ahead of dissemination. Although this commentary is not produced by an independent source, FXCM takes all sufficient steps to eliminate or prevent any conflicts of interest arising out of the production and dissemination of this communication. The employees of FXCM commit to acting in the clients' best interests and represent their views without misleading, deceiving, or otherwise impairing the clients' ability to make informed investment decisions. For more information about the FXCM's internal organizational and administrative arrangements for the prevention of conflicts, please refer to the Firms' Managing Conflicts Policy. Please ensure that you read and understand our Full Disclaimer and Liability provision concerning the foregoing Information, which can be accessed on the website.

MSFT can be back from the bottom of the channelhi my friends
one weekly support line and one broken channel from the bottom that caused the price to decrease one level on the channel down.
now the market has to decide, is a recession coming?
it is not an advice for buy or sell
NFA

AMZN - Update - Another retailer in trouble? This is an update to my August 8th sell publication.
A sell recommendation...Appears to be a common theme among retailers...
As you can see there was a breakdown through the white median line on October 28th.
I believe we are now in the middle of the "C" wave with a downward acceleration about to commence.
My price target is in the mid 50's area... TBD.
Weekly view here

Major BULLISH signal - (AMZN)Amazon (AMZN) offers a good buying opportunity.
Disclaimer: All content has only educational and informational purposes, and never should be used or take it as financial advice.

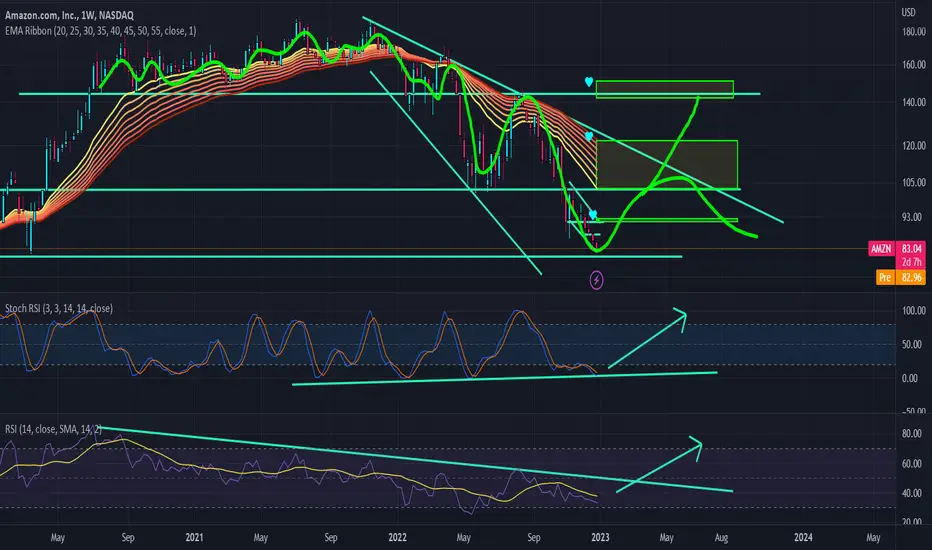
Dead Cat BounceFrom the current levels its very likely that we may see some buying pressure but this would be very only till the resistance zone most likely. And from there shorts will enter the trade to bring the price down. Watch out the trendline, wait for a breakout/reversal. Let the price first break 20 day MA to consider longs.
Hit like & follow guys;)

AMZN....4H= Technical analysis of AMZN on the 4-hour chart
= The price is inside a downward channel in general
= He built a wedge pattern
= There are currently four purchasing targets available


AMZN long for DCBexpecting a bounce from this level.
filled the opening gap down with a nice closing price.
TP 104. let's see.

quick amazon long spotquick weekly long here. maybe with some feb 90-80$ calls. daily squings alone could net some real nice gains.