$HUM with a bullish outlook following its earnings #Stocks The PEAD projected a bullish outlook for $HUM after a negative under reaction following its earnings release placing the stock in drift D with an expected accuracy of 33.33%.
HUM trade ideas

#HUM weekly 3-2-2 reversalHello dear Traders,
Here is my idea for #HUM
Price closed above yellow line
Targets marked in the chart
Invalidation level marked with red line
IV30 % Rank: 6% Subdued
Good luck!
❤️Please feel free to ask any question in comments. I will try to answer all! Thank you.
Please, support my work with like, thank you!❤️

Humana seems to continue its downtrendHumana bounced off the Fib resistance zone. Key support at $478.41 needs to hold in order for the trend to change direction. A close above $520.77 may indicate a new uptrend maybe on cards.
Disclaimer: My opinion on stocks are mine alone and not to be taken as Investment advice.

10/23/22 HUMHumana Inc. ( NYSE:HUM )
Sector: Health Services (Managed Health Care)
Market Capitalization: 64.611B
Current Price: $510.54
Breakout price trigger: $515.20
Buy Zone (Top/Bottom Range): $496.45-$473.95
Price Target: $562.30-$568.90
Estimated Duration to Target: 147-156d
Contract of Interest: $HUM 1/20/23 520c
Trade price as of publish date: $26.20/contract

HUM: Test previous lows?Humana Inc
Short Term - We look to Sell a break of 480.38 (stop at 489.09)
Short term momentum is bearish. Daily/Weekly Ichimoku Cloud resistance is seen at 488. Further downside is expected. A break of 480.00 is needed to confirm follow through negative momentum.
Our profit targets will be 455.29 and 440.00
Resistance: 500.00 / 520.00 / 580.00
Support: 480.00 / 450.00 / 400.00
Please be advised that the information presented on TradingView is provided to Vantage (‘Vantage Global Limited’, ‘we’) by a third-party provider (‘Signal Centre’) . Please be reminded that you are solely responsible for the trading decisions on your account. There is a very high degree of risk involved in trading. Any information and/or content is intended entirely for research, educational and informational purposes only and does not constitute investment or consultation advice or investment strategy. The information is not tailored to the investment needs of any specific person and therefore does not involve a consideration of any of the investment objectives, financial situation or needs of any viewer that may receive it. Kindly also note that past performance is not a reliable indicator of future results. Actual results may differ materially from those anticipated in forward-looking or past performance statements. We assume no liability as to the accuracy or completeness of any of the information and/or content provided herein and the Company cannot be held responsible for any omission, mistake nor for any loss or damage including without limitation to any loss of profit which may arise from reliance on any information supplied by Signal Centre.

$HUM, $XLV, Healthcare sector worth watching nowIf you have been invested in healthcare stocks or ETF's you may want to take profits between now and the end of October. I am keeping an eye on this chart for some good trades. It is a low volume stock with very low options volume, so be very selective with your entry time/place and your option price. Daily trading ranges can be large or small, so give extra consideration to time frame and holding time in your trade plan.
Please note on the chart:
* Linear regression channel shown from 2019
* Yellow dashed lines showing 370-470 trading range
* Light yellow rectangle shows two-year range which was recently broken higher
* White line (channel center) regularly acts as support or resistance, price is wavering along this line
* RSI only had one instance of going over 67 (white oval) or under 33 since 2019, and that resulted in sharp reversal, for now it is moving lower
* Stochastic %D has completed three peaks since dipping below 30 and is now turning down
Price was weak on Monday and closed lower, but still in its recent range (sideway. I am looking at a few possibilities for trades:
* If the market rallies this week HUM may stay under the white line and selloff down to 457, 435
* If the anticipated October leg down occurs, then price may move up to analysts' 550 price target (also top of channel)
* Price has been sideways for two weeks, so it should move higher/lower soon

CrabBearish Crab.
It appears the last leg up of this Crooked W terminated just above the 1.618.
No recommendation.
Bearish Harami Cross so far today.
Price is well above the .236 of the trend up
Rising Wedges noted.

$HUM with a Bullish outlook following its earnings #Stocks The PEAD projected a Bullish outlook for $HUM after a Negative Under reaction following its earnings release placing the stock in drift D with an expected accuracy of 20%.

Buy ideaA nice running flat detected.
This is the update to the earlier idea for Humana. Linked to this idea.
As a rule for entering any trade, need to get a confirmation.
There are different classical entries - for zigzags, flats, just google. They are simple, but you have to be patient, even if the core structure looks complete.
Don't trade expectations, any entry should be a rules-based one.
Trade safe


HUMANA - Breaking out?Or a false break? Lately breakouts are often false. need to be cautious.
1. Beakouts should be supported by large volumes. 50/50 in this case
2. If it ultimately goes up, 635 is the target.
Note, this is not a fin recommendation.
Trade safe

$UNH Breakout - Thanks @Aiten :)#HUM Breakout 🚀 in 1h Chart on above average volume
All Entry Criteria have been met:
1. Price above 10, 20 & 50 EMA ✅
2. Consolidation Phase in Uptrend ✅
3. Breakout on above average Volume✅
@Aiten : Thank you very much for the hint :)

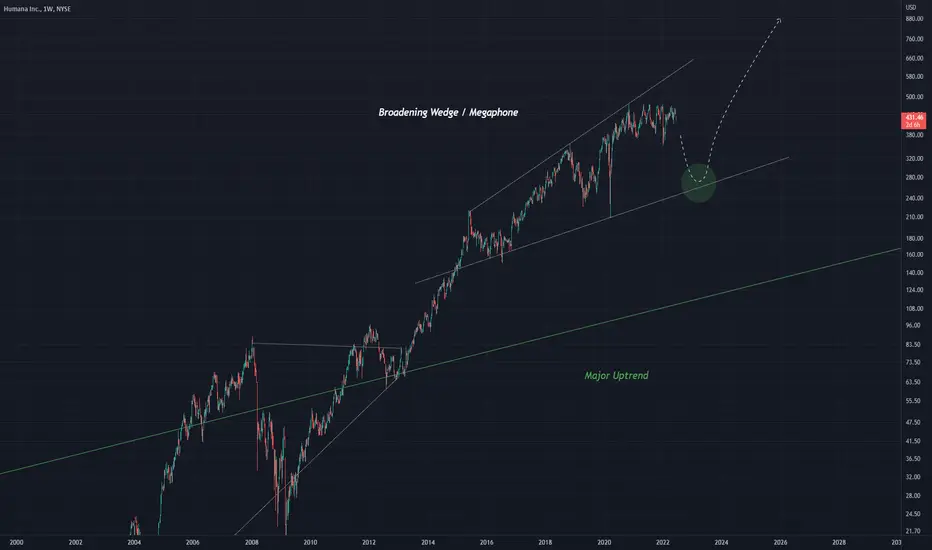
HUM - Megaphone / Broadening FormationWhile the green trend line is the strongest, price has pushed itself above it and is currently within this megaphone structure
I expect price to retest the bottom trend line of this structure and then move up further
Bullish after a small pullback
$HUM Humana LT Chart - LEAP OptionsHumana fairly rangebound for the last six months. Tested ~$470 key resistance level six times unsuccessfully. Monitor for a breakthrough and close above this level. Once this occurs we could see an overdue strong move to the $600 area by 1H of 2024.
Long Term Target: $580-$615 range by 1H '24
I plan to play this using LEAP options. I'm looking at the $450 and $500 Jan'24 calls. If you're looking to limit risk and capital outlay, I would consider a vertical call spread buying either the $450 or $500 call and selling the $600.
Note: This is NOT investment advice. This is opinion only.

$HUM with a Bullish outlook following its earnings #Stocks The PEAD projected a Bullish outlook for $HUM after a Positive Under reaction following its earnings release placing the stock in drift A with an expected accuracy of 60%.

HUM SHORTWith increasing hospitalizations and more surgical procedures after the pandemic slowdown leading to higher spending.
Next target 375ish.

HUMLooking at it through the weekly, maybe 3 or 4 more week until we see some big institutional buys, judging off the macd.

HUMANA TRENDCharting the SP 500 and came across this pattern!! Do your due dilligence and set your alerts!!!


HUM Post-earnings pullbackNYSE:HUM Humana's post earnings run-up has pulled back to a 50% Retracement level and held this morning along with a volatility spike.


HUM- Possible bullish breakout March 19 $375 Call --- Target $400 reversal of bearish trend short term
