NVDA RetracePrice has had a great run up ... now appears price is at the fib extension 2.272% and a retrace back to the major trendline may be in order.
Also review the Stochastic RSI and RSI on the Monthly; confirmation may be when the lines cross down thru the 80% level.
NVDA trade ideas

[SHORT] Trend is over! #NVDATrend is ended... #NVDA short time for #NVDA
*Head & Shoulders formation*

AI Hype Drives NVIDIA to All-Time HighNvidia Corp. is experiencing a strong start following its upward trend since 2023. The company, known as the most valuable chipmaker globally, recently unveiled three new desktop graphics chips. These chips offer enhanced capabilities such as increased processing cores, faster memory, and improved gaming experiences with high-resolution images and AI-driven characters.
The introduction of these new chips indicates that the competition in the PC chip market, encompassing both CPUs and GPUs, will intensify in 2024 due to the arrival of AI chips. Nvidia's launch of the H200 GPU is expected to solidify its market dominance in the generative AI sector by establishing new GPU standards.
In addition, Nvidia has developed three chips specifically designed for the Chinese market, addressing the region's growing demand for AI systems while complying with US export controls. This strategic move allows Nvidia to maintain its presence in one of its most crucial markets.
The company will release its quarterly financial results on Wednesday, February 21st. We would potentially see a significant year-over-year revenue growth of approximately 230% for the December quarter.

It is fun while it lasts, AI bubble will burst sooner than laterLove the stock. There is no doubt that NVIDIA is selling shovels to gold miners (AI companies) right now.
It is just too expensive. No company of this size can grow at the pace investors are expecting from NVIDIA right now. The first earnings miss or negative forecast will tear this apart.

NVIDIA: solid uptrend that can last till AT LEAST February Using the duration of the cycles (from Hurst) and adapted to the market stock by TRADOMICS, we try to answer in this video, giving a rational based on data, how long can the price of NASDAQ:NVDA keep raising up.

NVDA - Price Action AnalysisIn this chart we're lookin at the strength in both buyers and sellers just like the previous upload.
Except this time we zoom in a bit closer to analyze the current wave and where its heading. So far price action looks great as we head into the expansion phase once again.
Momentum shows that there are only about 10% sellers out the 100% buyers in the last rally giving you about 80% strength in buyers which equals to healthy price action coming from the bulls.
Chart 2 - Detail
A buy signal was triggered around $420 and $480
The chart shows how
- Price broke out of a brief pause and back into continuation
- The triple bottom at SnR (supply/demand) that eventually led to price breaking out past the
faint trendline.

NVDA is approaching critical tops
Nvidia is approaching a critical level. If the upper resistance does not hold we could see a downtrend over the next 15 days or so. This may correspond to the next leg on the SPY seasonality chart.

NVDA Into The FutureThe analysis captures price action strength in sellers and buyers highlighted in green and red. By doing so, this allows me to get an idea where price is likely headed and at the same time using parallel trendlines to help the target areas ($1,150/$2,250), and pullbacks.

NVDA double top and reversalNVDA has hit resistance twice at the same area, indicating a double top. The neckline is highlighted in pink, the pattern itself in yellow. There is a big earnings gap from when NVDA took off and became ridiculously expensive.
I think it would be considered very risky for anybody to buy now at these prices. The earnings gap is the gray box, also a price target.
A break of $400 would confirm the double top pattern. I think it's important to try and find developing patterns and lay out some probable scenarios. It's often too late to get in after a pattern is confirmed because everybody is expecting the same move and the move gets exaggerated.
Happy Trading and Merry Christmas!

The goal of the global cycle is $ 520, followed by a collapse.We have almost reached the goal of five waves of the entire Fibo cycle to the area of $ 520, then there is a law-based correction of the ABC of the entire cycle, the first stop is the area of $ 270, we will come there on time as I plan to correct the entire market somewhere by the summer of 2024.

NVDA at the CES Ahead of Earnings Next MonthNASDAQ:NVDA moved up on the excitement around AI at the Consumer Electronics Show. We can see that Professional Traders were anticipating a breakout.
The stock should be able to begin some pre-earnings runs soon, as long as revenues and earnings continue to improve.
Volume Oscillators and Money Flow Indicators have been improving as Derivative Developers continued to increase inventory.

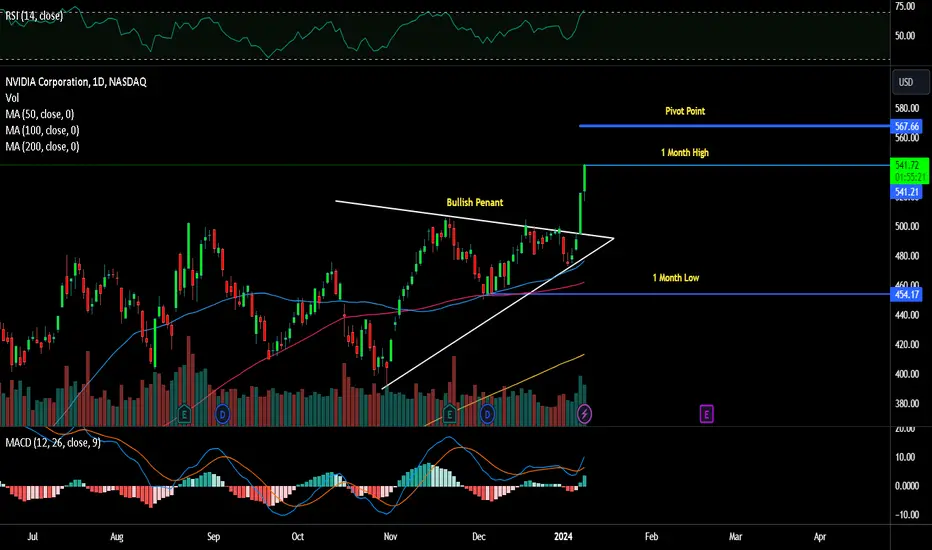
NVDA "AI King" BreakoutNvidia stock NVDA price just hit a new all time high Monday after the chip company unveiled new products and partnerships at the annual Consumer Electronics Show (CES).
The company rolled out three new chips that will let gamers, designers and other users make better use of AI on their personal computers.
Technically speaking, the stock NVDA is still having the room to test $530/$544 projected targets on the short term.

NVIDIA BULLISHNVIDIA Bullish @ Daily TF
Story: Printing Bullish Trend
Anticipation: Can continue making new HH & HL since bearish divergence was not formed
Plan: Buy Limit at .382 Fibonacci level of last HL to HH while riding Dow's Trend

NVDA: Might be making a long term top! Technicals suggest NVDA may be making a long term top. There is strong divergence observed on the monthly chart and the price is hitting upper end of the trendline. There can be slight overthrow out of the channel. However a sustained move outside of the channel is unlikely.

NVDA End of the year outlookIn case of a bullish HA candle closing I would personally consider NVIDIA as a buy.

📈🚀Will Nvidia Rise Above $600?💹In the last post on tradingview you saw just the importance of cash flow.
--
Do you think cashflow is important? When you decide to trade?
--
Cashflow is the life blood of any business.
Also you use this fundamental analysis to your advantage.
Use:
-The Rocket Booster Strategy
-Cashflow Analysis
-A Good Trading Tool Such as TradingView
Rocket boost this content to learn more
Risk of Loss:
Trading stocks carries inherent risks, and past performance is not indicative of future results. Individuals should be aware that they may lose all or a substantial portion of their investment. It is crucial to carefully consider your financial situation and risk tolerance before engaging in stock trading activities.

Nvidia (NVDA) Breaks to New All-time High, What's Next?Nvidia (NVDA) broke to new all-time high as we start 2024. The stock shows incomplete impulsive structure from the last significant low on October 31, 2023 low. The rally from October 31 is unfolding as a 5 waves impulse Elliott Wave structure. Up from October 31, wave ((1)) ended at 505.48 and dips in wave ((2)) ended at 450.10. The stock then resumes higher in wave ((3)) with internal subdivision as 5 waves. Up from wave ((2)), wave (1) ended at 504.33 and pullback in wave (2) ended at 473.20. Internal subdivision of wave (2) unfolded as a flat structure. Down from wave (1), wave A ended at 480.8 and wave B ended at 499.97. Wave C lower ended at 472.6 which completed wave (2).
Up from wave (2), wave 1 ended at 481.8, and pullback in wave 2 ended at 473.20. Stock resumes higher in a nest. Up from wave 2, wave ((i)) ended at 485 and dips in wave ((ii)) ended at 477.30. Stock resumed higher in wave ((iii)) towards 543.25 and pullback in wave ((iv)) ended at 530.18. Expect the stock to extend higher to end wave ((v)) of 3. Afterwards, it should pullback in wave 4 to correct cycle from 1.3.2024 low before it resumes higher. Near term, as far as pivot at 472.6 low stays intact, expect pullback to find support in 3, 7, or 11 swing for further upside.

NVDA: What Lies Ahead Following A Massive BreakoutNVIDIA (NVDA) shares broke out in one of the cleanest moves you’ll come across. The current 4-day rally is now more than 12% - the best such stretch since the chip designer posted its now-famous earnings blowout and incredible guidance figures in May 2023. NVDA’s rally has helped the Information Technology sector reclaim losses to start 2024. But where will the stock go next? Let’s put on our technician hats and investigate.
Following the quarterly results posted in the second quarter of 2023, NVDA went on to trade in a trading range between support near $400 and resistance around $510. That $110 zone is key as we can now add that on top of the $510 level to arrive at a bullish upside measured move price target to $620. That means roughly 14% more upside from the current price.
It will be key to watch for a possible pullback to $510 – what was once resistance becomes new support. As it stands, implied volatility on NVDA is moderate at 36%, and the company’s next earnings report is not due out until February 21. So, we may have to pay closer attention to what its industry peers have to say in nearer-term Q4 profit reports. As for NVDA’s valuation, following the technical breakout, the company trades 43.4 times 2024 consensus operating EPS forecasts and under 27 times out-year EPS estimates.

Nvidia Long-Term ChartWe are definitely in our wave v of 5 of larger (1) now. In the smaller patterns a move to $650 is not out of the cards...however, please understand your trading the final machinations of a very long term pattern.
A breach of the $400 will signal a potential move back to the sub $100 area.

NVDA H4 : SELL CORRECTION (CHART PATTERNS) NVDA H4 : SELL CORRECTION (CHART PATTERNS)
NVDA is about to fall in to deep after hitting the highest rose and now looking for resistance to reach the lower support levels again.
NOTE: KEEP FOLLOWING ME FOR MORE UPDATES AND ANALYSIS AND INFORMATION ABOUT DIFFERENT PAIRS, INDICES, FOREX, CRYPTO.....

NVIDIA ($NVDA) Future of AI-Enabled DevicesNVIDIA ( NASDAQ:NVDA ) appears to be on an impressive trajectory, bolstered by the recent unveiling of its GeForce RTX 40 SUPER Series GPUs at CES 2024. These graphic processing units, built on the Ada Lovelace architecture, promise a significant leap in AI-powered PC experiences. The GPUs boast remarkable capabilities, with up to 52 shader TFLOPS, 121 RT TFLOPS, and 836 AI TOPS, setting new standards in gaming realism and AI-enhanced experiences.
The introduction of these AI-powered chips aligns well with the emerging demand for AI-enabled PCs. Despite recent challenges in the PC market, including declining demand and economic uncertainties, NVIDIA's forward-thinking approach positions it to capitalize on the growing opportunities in the AI PC segment. PC manufacturers like HP Inc. and Dell Technologies are also gearing up to roll out AI PCs, anticipating a recovery in the PC market in 2024.
NVIDIA's transformative technology goes beyond gaming, extending across various sectors such as deep learning inference, generative AI applications, and productivity tools like Adobe Photoshop. The RTX 40 SUPER series chips, equipped with specialized AI Tensor Cores, represent a monumental leap in AI capabilities for PCs, promising users transformative AI experiences.
The technical analysis further supports the positive outlook for NVIDIA. The stock is in a rising trend channel, indicating positive development and increasing buy interest among investors. The recent breakout through resistance levels and the positive signal from the rectangle formation suggest a potential further rise in stock price.
In summary, NVIDIA's strategic focus on cutting-edge AI chips, its readiness to meet the demand for AI-enabled PCs, and the positive technical indicators make it a compelling investment opportunity. The company's commitment to innovation positions it well in the evolving landscape of AI-centric computing, making NVIDIA an attractive choice for investors seeking growth in the technology sector.
Breakout Alert: Nvidia (NVDA)Revolutionary AI-Optimised Graphics Propel Nvidia's Breakout
After months of sideways consolidation, Nvidia’s share price broke and closed decisively above resistance during yesterday's session – potentially reigniting the stocks powerful long-term uptrend.
Nvidia, a key player in the AI revolution, had an exceptional 2023, with its stock value more than tripling. However, the majority of these gains occurred in the first half of the year. Since summer, Nvidia's stock has been consolidating within a sideways range, as indicated in the chart below.
These prolonged consolidation phases within an established trend are not just typical but also beneficial. They facilitate stock rotation, involving accumulation and distribution, which helps prevent the trend from becoming overly stretched.
The breakthrough to new trend highs occurred following Nvidia's announcement of groundbreaking desktop graphics processors tailored for AI purposes—the GeForce RTX 40 SUPER Series. This unveiling triggered a substantial 6.4% surge, propelling the stock to close at record highs. Additionally, ahead of the Consumer Electronics Show in Las Vegas, the company introduced other AI-related components and software.
Nvidia (NVDA) Daily Candle Chart
Past performance is not a reliable indicator of future results
A Closer Look
If we take a closer look at yesterday’s breakout, there are several technical factors which indicate that the breakout has potential to continue:
Backed By Volume: On the hourly candle chart (below) we can see that the breakout was backed by an increase in volume – signalling increased participation. Volume acts as a validation mechanism for breakouts. It provides confidence to traders that the breakout has a stronger chance of being a genuine shift in market sentiment, rather than a temporary blip.
Higher Swing Lows: From November to December, Nvidia’s share price had been carving out a series of higher swing lows as the market repeatedly tested resistance. This signals that institutional ‘smart money’ traders were accumulating shares prior to the breakout.
Strong Close: Yesterday’s price action saw the shares maintain the breakout into the closing bell. This signals strong demand and reduces the probability that the breakout will fail.
Nvidia (NVDA) Hourly Candle Chart
Past performance is not a reliable indicator of future results
Disclaimer: This is for information and learning purposes only. The information provided does not constitute investment advice nor take into account the individual financial circumstances or objectives of any investor. Any information that may be provided relating to past performance is not a reliable indicator of future results or performance. Social media channels are not relevant for UK residents.
Spread bets and CFDs are complex instruments and come with a high risk of losing money rapidly due to leverage. 75% of retail investor accounts lose money when trading spread bets and CFDs with this provider. You should consider whether you understand how spread bets and CFDs work and whether you can afford to take the high risk of losing your money.

NVDA
NVDA experienced a slight dip from yesterday's high, and currently, it is showing signs of an upward trend. If it surpasses the 528 mark, it could potentially reach a new all-time high.
