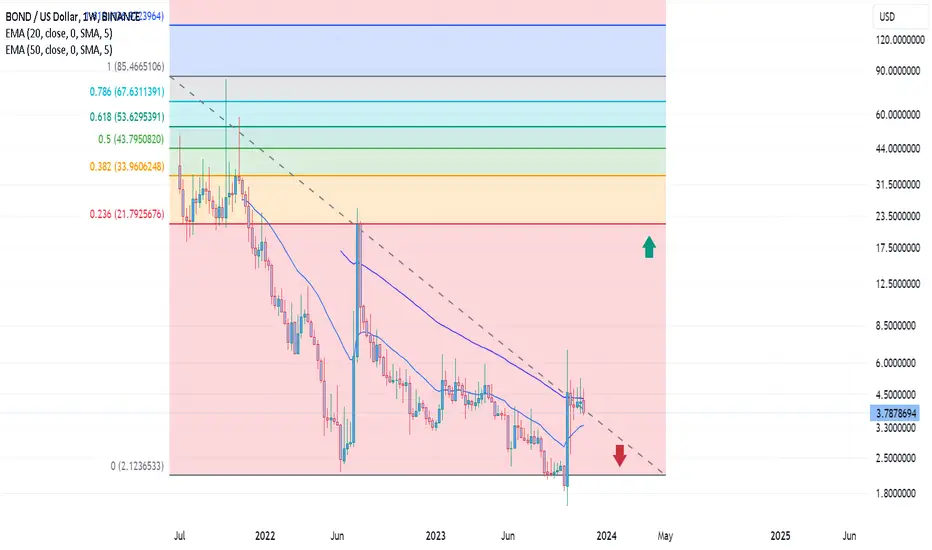
BOND - it bottom in?BOND is trying to form a bottom. Price is in oversold range with bullish divergence and pattern is similar to AIOZ before it reversed. Once it bounces up it can move very fast so it's possible to break diagonal resistance line and push on without testing. Looking for test of fibb 0.786 range but mo
Key stats
Selling at $18Ive accumulated a lot these past couple months from $1.38-$2, I expect price to reach around $19.20 or so but will sell conservatively at $18. I expect it will go beyond the $6 figure because on the weekly CRYPTO:KRAKENUSD chart there is a large multi-year triangle, that once the $3-4ish resistance
Cool Pattern Going onJust look at the current wick and body structure occurring at the top yellow resistance line. Very interesting. In general, Im bullish on this coin looking at other technical charts, but this pattern is fascinating to say the least. Im expecting it to honestly break above the yellow at some point, b
BONDUSDAs we see, playing with BOND is very changeable. 21 usd is BIG reistance. Price tried many times to break through. We could say that 21 usd is very dificult to cross it. Falling period is not over. For growing period we need price over 6 usd.
Will we see 2 usd again? It is possible. According to th
See all ideas