PIDILITIND Looking Good For SwingWhat we believe in :-
°Trade With Logic
°Take Time Before Investment
Saving Your Capital 🙂
I'm not responsible for your profit or loss.
Mainly Stock & Crypto Investor 🕵️| Interim Trader 📊
DISCLAIMER :- This Channel Is For ( EDUCATIONAL PURPOSES )
PIDILITIND trade ideas

pidiliteNSE:PIDILITIND
Please note that we are not a SEBI Registered Investor Adviser/PMS/ Broking House.
All the contents over here are for educational purposes only and are not investment advice or recommendations
offered to any person(s) with respect to the purchase or sale of the stocks / futures and options.
You are also requested to apply your prudence and consult your advisers in case you choose to act on
any such content available as WE claims no responsibilities for any of your actions or any outcome of
such action

Random Stock Analysis Series - Pidilite IndustriesRandom Stock Analysis Series - Pidilite Industries
My Analysis:
------------
** Daily Timeframe **
1. Jumped in May till Jul last week.
2. Current price is at 100 MA and slightly above 200 MA - indicating that this stock is in a bearish mood.
3. Since 19th Oct 2021, it is forming an ABC correction wave from ATH of Rs.2520.
4. In this ABC correction wave, it fell 14%, in 1.5 months
5. Wave C point is marked at 1.618 Fib retracement level and likely to go up from this point of at least 10% target - marked in the chart.
6. Sellers are high in volume. The current price is the Entry point but needs two green candles in a daily timeframe to confirm and take the trade.
7. Wait for 2 green candles to enter.
Note:
I'm not recommending buying this stock. This is for education purposes.
This is my view, based on my learning.
Please do not trade without your own conviction.
Please invest after careful research. I'm not responsible for your profits/losses.
- Gnanasekaran


Bearish Flag PatternA bear flag is a technical pattern that provides an extension/continuation to an existing downward trend. The bear flag formation is underlined from an initial strong directional move down, followed by a consolidation channel in an upwards direction (see image below). The strong move down is known as the ‘flagpole’ whilst the consolidation is referred to as the ‘flag’ itself.

pidiliteNSE:PIDILITIND
Please note that we are not a SEBI Registered Investor Adviser/PMS/ Broking House.
All the contents over here are for educational purposes only and are not investment advice or recommendations
offered to any person(s) with respect to the purchase or sale of the stocks / futures and options.
You are also requested to apply your prudence and consult your advisers in case you choose to act on
any such content available as WE claims no responsibilities for any of your actions or any outcome of
such action

PIDILITE INDUSTRIESPIDITILE in uptrend after correction.
more correction expected till 2090 max which is a good support.
Buy some quantity at 2282/CMP.
Buy More quantity at 2173 & 2090.
it it expected to bounce back from 2173 & 2090.
SL 2030.
Its a very good stock which has monopoly in market.
so always better to buy at any price some quantity and buy more at each support level.
positional tgt is 3000+
Please correlate yourself also on charts. this is for educational purpose only. must consult with your financial advisor before investing.

PIDILITE INDUSTRIE - Dont PIDILITE INDUSTRIE - Negative
RSI - 37.69 - Enter once it reach 60
MACD - Downtrend
Alert
Below 50 Day Moving Average - Enter only at 2420 Levels only
Support levels - 2291 & 2161 & Above Support Level 2330 & 2361

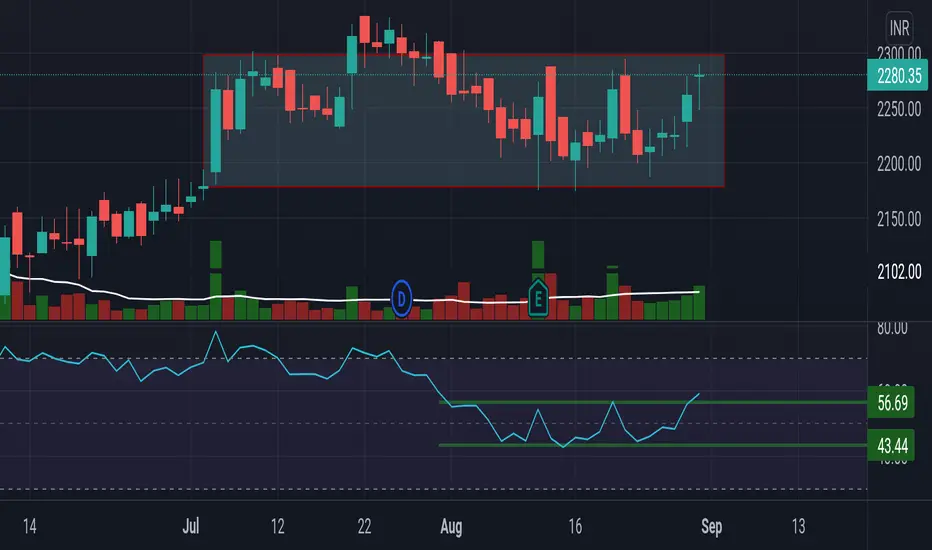
Go Long Stock has been consolidating for 20 days and it can show a triangle pattern breakout anytime

Go longGo Long, as price broken a flag pattern, and retest its support level now it will go to make another all time high.

PidiliteAt supply zone... But stock is bullish buy above 2425 on hourly closing basis levels on chart.... Journey towards new high

PidilitePidilite is 10 points away from its resistance breakout, i think it will break resistance of 2418.
Aggressive traders can buy @ cmp 2409 with sloss of 2384 & tgt if it breaks 2418 thn 2450.
Safe traders wait for breakout.

Buy PIDILITIND around 2430 with sl 2260 for trgt 2775Buy PIDILITIND around 2430 with sl 2260 for trgt 2775

Pidilite can go long If it holds 2425 go long target 1 nd targPidilite can go long If it holds 2425 go long target 1 nd target 2 as mentioned in charts With SL 2408

Breakout Trade Idea for PIDILITINDToday Pidilitind has a breakout and crossed above 52-Weeks high. Buy Pidilitind between 2390-2410 with SL 2280 for much higher targets. Target open
Disclaimer :
Trading is never ever recommended as it is injurious to mankind. This is purely my study based on technical charts and for educational purpose only. Please do your analysis before taking any trades given by me. I MUST not be held responsible for any profit or loss out of any trades you take on our advice. All Disclaimers Apply.


watch for ATH breakout in PIDILITE INDIAbuy above 2327 for target of 2450 in swing trade with stoploss of 2250
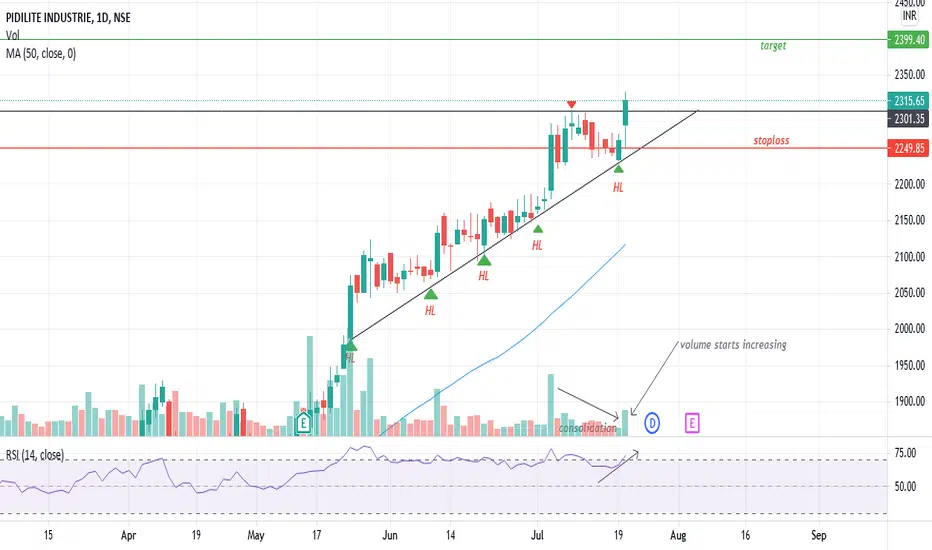
pidilitthis is good example for consolidation breakout and formation of triangle pattern
and giving good returns.here in this stock it discount the future as it is approching earnings date
if the earnings are good then it may consolidate or move up ,if they are not good the it may move down


