PIDILITIND trade ideas

PIDILITIND - Bull Pennant breakout - Swing TradeThe above analysis is done purely on basis of Price Action & Chart Patterns.
The analysis is done on daily TF hence price may take few days to few weeks in order to reach the targets.
Trade setup is explained in image itself. Entry can be either above the breakout candle or on small pullbacks as well.
The above analysis is purely for educational purpose. Traders must do their own study before entering into any trade. Traders must trade as per their own risk taking capacity and money management.
Feel Free to comment or message me for any query or suggestion regarding this stock or Price Action Analysis.
Checkout my other ideas to understand how one can earn from stock markets with simple trade setups.

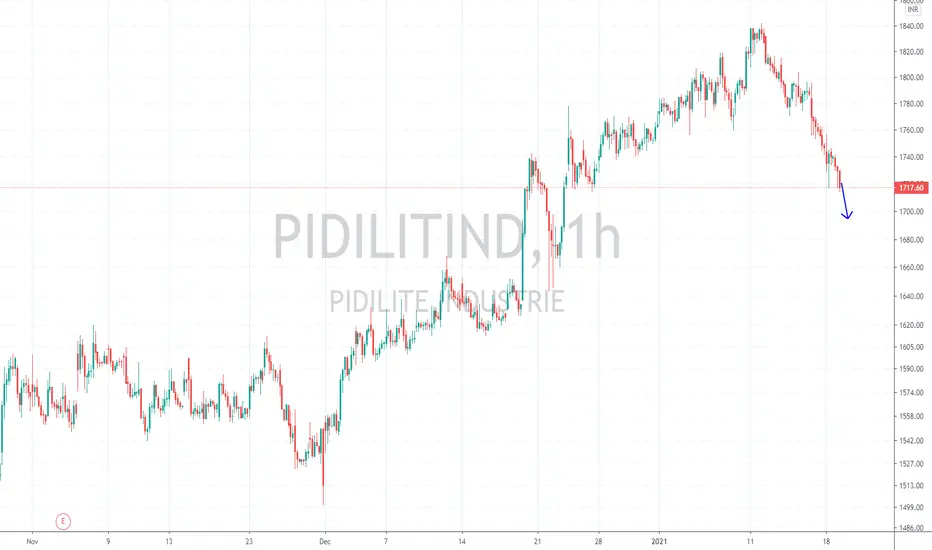
PIDILITE breakout and retest.PIDILITE has given a breakout from a symmetrical triangle pattern on 1hr time frame. It went through a pullback to retest the recent high and is now on the move upwards.


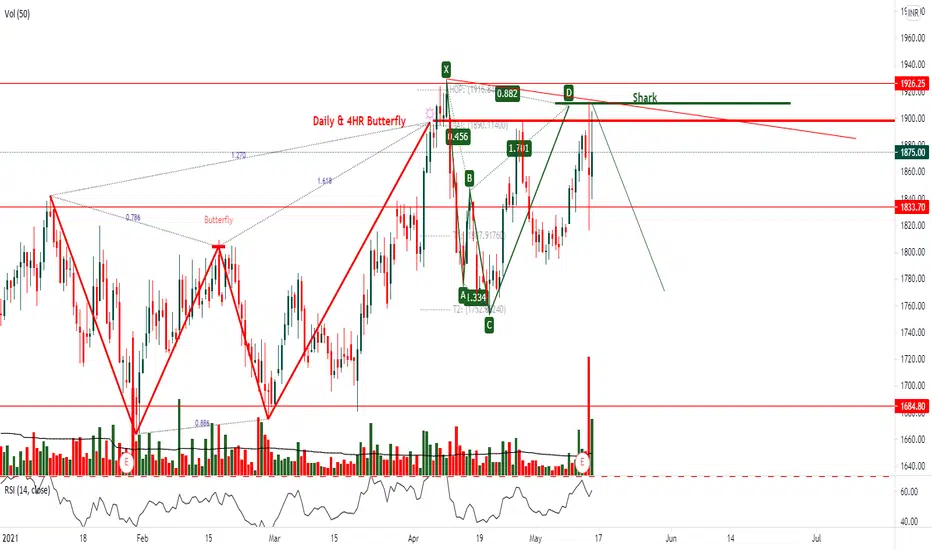
PIDILITIND 4HRCONFLUENCE OF DAILY & 4HR Bearish BUTTERFLY + SHARK
price need to follow Green Trend line & hit target
If price Breaks Red Trend line is where EXIT before SL hits
POTENTIAL SELL
PIDILITIND ::: LONGDATE: 25.04.21
INSTRUMENT: PIDILITIND
TIMEFRAME: DAY
TREND: BUY
CMP: 1783
BUY ABOVE: 1784
SL: 1750
TGT 01: 1805
TGT 02: 1822
TGT 03: 1839
DISCLAIMER:
WE ARE NOT S E B I REGISTERED ANALYSTS. PLEASE CONSULT YOUR PERSONAL FINANCIAL ADVISOR BEFORE INVESTING. WE ARE NOT RESPONSIBLE FOR YOUR PROFITS/LOSSES WHATSOEVER.

Pidilite is at historical support.Pidilite is at historical support. One can buy now. Target 1950. Holding time 1.5 months.
Exit if trend line is broken. Marked the possible price movement in chart.

PIDILITE ( DAILY ) - Box BreakoutBox Breakout
Volume > Average on breakout
Stochastic turning from oversold
RSI = 55
< 20% Selling wick
Breakout after Retracement
Buy above 1843

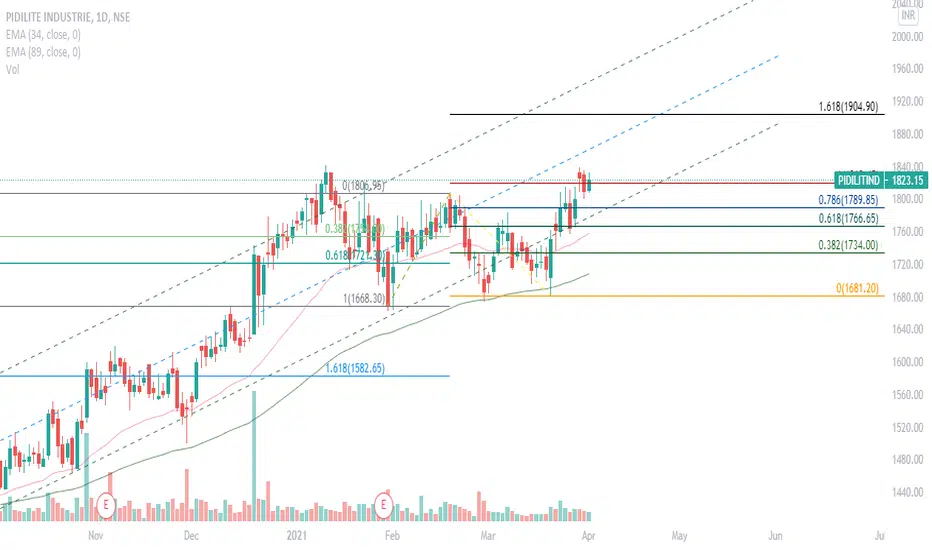
Pidilite Ind = Buying opportunity arriving in few daysSupport is placed at 1660, Flag pattern observed from 1842 to 1663, managed to breakthrough and created a high at 1928.50, and now the correction is on the way, which seems to end near 1775 - 1730 levels. One must observe for good convincing signals around those levels for buying opportunity.

Good Upside movePidilite is going up with strength and accumulated volume, Can give targets of 1840 and above.

Pidilite AnalysisPidilite is very good momentum stock. It has its own pace. Trying to test the all time highs. May give upside of 60-70 points.
Pidlite Short term trade 3-4 days holdLets see if tred line break then all targets to be completed in next 2-3 days


PIDILITE DAILY TimeFramePIDILITE on a DAILY Timeframe
Pidilite is forming a symmetrical triangle of Daily Timeframe.


Pidilite Industries - Intraday Trade SetupPidilite Industries CMP - 1726.85
Looking bearish in higher time frame. One can go for Intraday / Swing Trade Setup with the following entry, exit & targets
Sell at or Below 1722 ONLY / Stop Loss 1732
Target 1 - 1714
Target 2 - 1704
Target 3 - 1694
Disclaimer: This is my view and for educational purpose only.