SBIN LONG 4 HR TRADEOn 240 mins, there are 2 levels, one below the other. Hence, either combine 2 levels or enter the distal line of 1 level and hold till SL or target.
Next report date
—
Report period
—
EPS estimate
—
Revenue estimate
—
75.15INR
670.85 BINR
5.90 TINR
3.84 B
About STATE BK OF INDIA
Sector
Industry
CEO
Dinesh Kumar Khara
Website
Headquarters
Mumbai
Employees (FY)
232.3 K
Founded
1921
ISIN
INE062A01020
FIGI
BBG000GQ5829
State Bank of India provides a range of products and services to personal, commercial enterprises, large corporates, public bodies and institutional customers. Its segments include Treasury, which includes the entire investment portfolio and trading in foreign exchange contracts and derivative contracts; Corporate/Wholesale Banking, which comprises the lending activities of Corporate Accounts Group, Mid Corporate Accounts Group and Stressed Assets Management Group; Retail Banking, which comprises branches in National Banking Group, which primarily includes Personal Banking activities, including lending activities to corporate customers having banking relations with branches in the National Banking Group, and Other Banking Business, which includes the operations of all the Non-Banking Subsidiaries/Joint Ventures other than SBI Life Insurance Co. Ltd. and SBI General Insurance Co. Ltd. Its geographical segments include Domestic Operations and Foreign Operations.

SBIN- Analysis
757 above this bullish and 724 below this bearish
Bullish Levels -above 757 then 827 to 861 then 1034 to 1068 then then 1241 to 1275 then 1448 to 1482 then 1655 to 1689
Bearish levels :- Below 724 then 620 (SL level)
**Disclaimer -
I am not a SEBI registered analyst or advisor. I does not repr

SBIN-LONGTraders can consider long positions on a confirmation from order flow with appropriate risk management strategies.

State Bank of IndiaTARGET MENTIONED IN CHART
SL - 545
PURELY TECHNICAL CALL
FUNDAMENTALS
Market Cap
₹ 5,52,612 Cr.
Current Price
₹ 619
High / Low
₹ 630 / 499
Stock P/E
8.14
Book Value
₹ 402
Dividend Yield
1.84 %
ROCE
5.20 %
ROE
16.8 %
Face Value
₹ 1.00
Promoter holding
57.5 %
EPS last year
₹ 62.4
E

SBI S/R for 8/7/24Support and Resistance Levels: In technical analysis, support and resistance levels are significant price levels where buying or selling interest tends to be strong. They are identified based on previous price levels where the price has shown a tendency to reverse or find support.
Support levels ar

sbin - longSharing my bullish outlook for SBIN based on SBIN. Would love to hear your thoughts and insights on this setup.

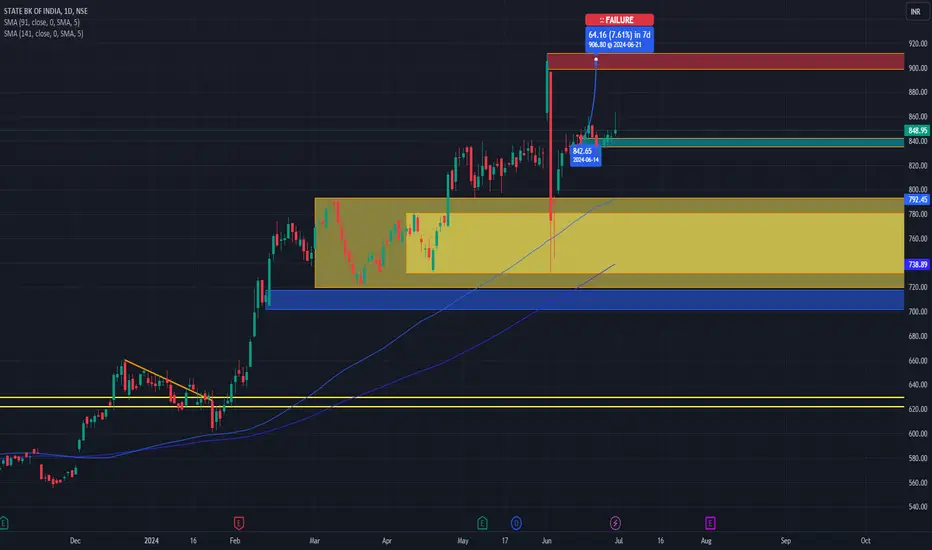
SBIN LONGSBI =Monthly Demand 793 Weekly 781 Daily still in Formation if closed above 848 with bullish mode Target 1070
SBIN INTRADAY TO SWING Sbi can give a good INTRADAY to SWING trade with a decent stoploss and good Targets
ENTRY - 839.5
Stoploss - 833
TARGETS - 860, 875, 890++
Note- if any trade or value that's gone from the marked levels then that's not our trade just let it go or wait for it to come back
I'm not sebi registered

[Turtle] SBIN 880CESelling SBIN 880CE at 8.75
When it goes down, will sell the PE
Note -
One of the best forms of Price Action is to not try to predict at all. Instead of that, ACT on the price. So, this chart tells at "where" to act in "what direction. Unless it triggers, like, let's say the candle doesn't break the

SBINKeep an eye on the STATE BANK OF INDIA as it approaches a minor resistance area. If the price holds above this level, it could present an opportunity for a profitable long trade.

See all ideas
An aggregate view of professional's ratings.
Trade directly on the supercharts through our supported, fully-verified and user-reviewed brokers.


Curated watchlists where SBIN is featured.

Frequently Asked Questions
The current price of SBIN is 862.95 INR — it has increased by 1.73% in the past 24 hours. Watch STATE BANK OF INDIA stock price performance more closely on the chart.
Depending on the exchange, the stock ticker may vary. For instance, on BSE exchange STATE BANK OF INDIA stocks are traded under the ticker SBIN.
SBIN stock has fallen by 3.73% compared to the previous week, the month change is a 2.51% rise, over the last year STATE BANK OF INDIA has showed a 40.48% increase.
We've gathered analysts' opinions on STATE BANK OF INDIA future price: according to them, SBIN price has a max estimate of 1,050.00 INR and a min estimate of 665.00 INR. Watch SBIN chart and read a more detailed STATE BANK OF INDIA stock forecast: see what analysts think of STATE BANK OF INDIA and suggest that you do with its stocks.
SBIN reached its all-time high on Jun 3, 2024 with the price of 912.10 INR, and its all-time low was 13.20 INR and was reached on Sep 21, 2001. View more price dynamics on SBIN chart.
See other stocks reaching their highest and lowest prices.
See other stocks reaching their highest and lowest prices.
SBIN stock is 2.39% volatile and has beta coefficient of 0.97. Track STATE BANK OF INDIA stock price on the chart and check out the list of the most volatile stocks — is STATE BANK OF INDIA there?
Today STATE BANK OF INDIA has the market capitalization of 7.57 T, it has decreased by 3.30% over the last week.
Yes, you can track STATE BANK OF INDIA financials in yearly and quarterly reports right on TradingView.
STATE BANK OF INDIA is going to release the next earnings report on Aug 3, 2024. Keep track of upcoming events with our Earnings Calendar.
SBIN earnings for the last quarter are 23.20 INR per share, whereas the estimation was 15.94 INR resulting in a 45.51% surprise. The estimated earnings for the next quarter are 18.34 INR per share. See more details about STATE BANK OF INDIA earnings.
STATE BANK OF INDIA revenue for the last quarter amounts to 590.22 B INR, despite the estimated figure of 525.00 B INR. In the next quarter, revenue is expected to reach 506.97 B INR.
SBIN net income for the last quarter is 213.84 B INR, while the quarter before that showed 110.64 B INR of net income which accounts for 93.27% change. Track more STATE BANK OF INDIA financial stats to get the full picture.
Yes, SBIN dividends are paid annually. The last dividend per share was 13.70 INR. As of today, Dividend Yield (TTM)% is 1.61%. Tracking STATE BANK OF INDIA dividends might help you take more informed decisions.
STATE BANK OF INDIA dividend yield was 1.82% in 2023, and payout ratio reached 18.23%. The year before the numbers were 2.16% and 18.12% correspondingly. See high-dividend stocks and find more opportunities for your portfolio.
As of Jul 27, 2024, the company has 232.30 K employees. See our rating of the largest employees — is STATE BANK OF INDIA on this list?
Like other stocks, SBIN shares are traded on stock exchanges, e.g. Nasdaq, Nyse, Euronext, and the easiest way to buy them is through an online stock broker. To do this, you need to open an account and follow a broker's procedures, then start trading. You can trade STATE BANK OF INDIA stock right from TradingView charts — choose your broker and connect to your account.
Investing in stocks requires a comprehensive research: you should carefully study all the available data, e.g. company's financials, related news, and its technical analysis. So STATE BANK OF INDIA technincal analysis shows the buy rating today, and its 1 week rating is buy. Since market conditions are prone to changes, it's worth looking a bit further into the future — according to the 1 month rating STATE BANK OF INDIA stock shows the buy signal. See more of STATE BANK OF INDIA technicals for a more comprehensive analysis.
If you're still not sure, try looking for inspiration in our curated watchlists.
If you're still not sure, try looking for inspiration in our curated watchlists.