(BTC) bitcoinAt last, finally I found someone who understands how to code an idea that can be modified to extract data on the chart to get closer to the idea I was trying to find. Now it is only a matter of time before I can construct and idea more specific to my idea. This is an image of BTC.
BTCUSD.P trade ideas

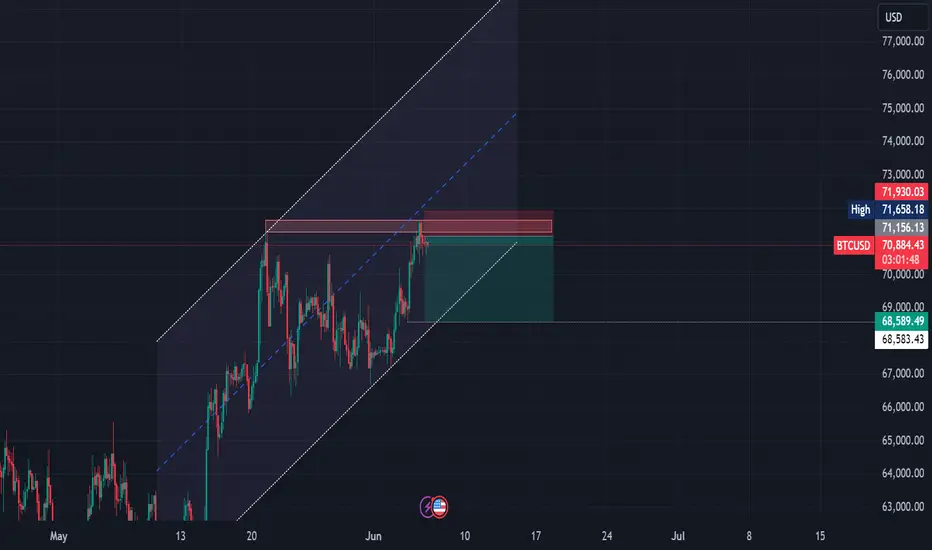
BTC sell before all time highs Short 1k pips to excute. Need to be more patient to catch the full potiental of a move

BTC USD - Volume Profile Support and Resistance LevelsLearn about Volume Profiles
Learn about Point of Control (Poc)
Learn about Value Area Highs (vAH)
Learn about Value Area Lows(vAL)
See how awesome volume profile from the first low to the last lower high in 2021 correlates to support and resistance levels > than 2021.

Look at this Bullish signIt seems we're about to a new bull run .🚀
Reverse head and shoulder is not ignorable...

Bitcoin: Wyckoff TheoryAccumulation or distribution? An important question which comes to mind at this spot.
Wyckoff's theory was simple, accumulation occurs when larger participants are bidding supply, while retail & soft spoken traders are taking profits. With a little socio-economical understanding; a very-viable-variable here. People like to spend in the summer, the only issue is.. they spend what they have, not what they borrow! Now, in a distribution phase, you can assume what happens. Larger participants offload previous bids into soft spoken buyers hands, and exit the market in due size & time... Let's give a little thought here - If Blackrock was buying throughout 30's to near now... would they sell? would they let themselves become other's exit plan? An independent decision to make on their side.
Wyckoff’s concept of the “Composite Man” has been idealized as a guiding 'radar' in the markets, a “Composite Man” should and will lead the markets, allowing soft spoken traders to factualize the understanding of order flow, liquidity preference & the demand for money. His personalized idea of a 'market maker' explains how anyone can determine meaning, curvature & limitations in the market that is being rationalized. The methodology provides a framework to visualize & grasp how liquidity is utilized. Highlighting potential zones for reversals, different phases, & driving actions of market makers.
As Bitcoin progresses through this range, our deviation will get narrower; resulting in a larger move in either direction. Lingering through summer while the euphoria lasts seems best fit. Which then would either drop off a cliff or rebound back, into the cold winter. The time-price opportunity here suggests this will happen before the end of summer, thus saying if we do reach the $63,000-$64,000 level from here by mid June, the likely-hood of a large move will become exponential. Versa, in hopes this is an accumulation phase, seeing $80,000 would give me the confidence to say.. buy more alts & hold on. It would be nice to see Bitcoin push for the $100,000 level, we all want cheaper prices, though I hope in the end we all want a greater world to live in.
Who's your exit liquidity?
Index:
preliminary support (PS)
secondary test (ST)
sign of strength (SOS)
automatic reaction (AR)
sign of weakness (SOW)


BTC Will continue to rise! Next target position 71705Sub-platform We bought BTC at 69978.48 to take profit at the first stage of 70848!
Today we can continue to buy BTC around the support of 70545!
Target price 71705!
In February, I publicly predicted that BTC would go from $30,000 to $70,000! The friends who listened to my prediction made more than double the profit!
But I'm more of a scalper trader so if you want live trading signals guidance and advice you can contact me! I can make you more than 200% profit per week

2026 BLOODBATH CRASH 12 MONTH VOLUME CHART reveals our 1-2-3 count down and reads we should GO LONG, NOT SELL. Avoid ideas making false claims BTC is crashing in year 2024 or 2025. We are on a BULL RUN and 2025 will be MEGA but then comes the GRIZZLY BEAR for a reset count down to 1.
We all have been warned for year 2026.

$BTC TOWARDS $80,000 ?👨🏻💻 CRYPTOCAP:BTC /USDT
#BTC has reached a strong daily resistance level that has been a barrier since March, despite the overall bullish trend, raising expectations of a potential retest of support📉
A short-term pullback to a key support level at 69,500 is expected👨💻
BITSTAMP:BTCUSD
- - - - - - - - - - - - - - - - - - - - - -
Follow #CryptoEase and Share it With Your Crypto Mate 😉


First ATH BREAKOUT Before Halving? Hello, Traders! Today, We have to Speak about King “₿”.
The Bitcoin Halving usually represents a significant milestone in the cryptocurrency's ongoing evolution. Satoshi Nakamoto programmed an event into the Bitcoin network every 210,000 blocks or approximately every 4 years. This will continue until the mining of 21 million coins (estimated to occur in ≈2140) marks the end of the cryptocurrency's issuance. To gain an understanding of its impact, it is necessary to analyze historical data:
1st Halving (Nov 2012): Price was ≈$12.0 (Pre-Halving), escalating to an unprecedented peak of ≈$1.240 in November 2013.
2nd Halving (July 2016): The price stood at ≈$600 (Pre-Halving), surging to a remarkable high of ≈$19.756 in December 2017.
3rd Halving (May 2020): The price was ≈$8.500 (Pre-Halving), catapulting to a new pinnacle of ≈$64.800 in April 2021 and ≈$69.000 in November 2021.
4th Halving (April 2024): At the time of this writing, the price has risen from ≈$64,000 to nearly $66,000.
In Bitcoin's early days, miners received 50 BTC for every new block they added to the blockchain. However, after the 1st Halving (November 2012), that dropped to 25 BTC. Then, after the 2nd Halving (July 2016), it became 12.5 BTC. After the 3rd Halving, it's down to 6.25 BTC. The 4th Halving (April 2024) reduced the reward from 6.25 to 3.125 BTC.
A review of historical data indicates that, in the period following each halving of Bitcoin, prices have consistently risen within a span of six to twelve months. However, the current situation is distinct. Why? This time, the price of Bitcoin reached a new high before the halving event occurred. The graph reveals that the previous ATH was achieved in November 2021 but was subsequently surpassed on 24 March 2024. It is noteworthy that the halving event occurred on May 1, 2024.
However, it's crucial to note that the relationship between halving events and price fluctuations is complex and multifaceted. It is not just expectations and moods. Numerous factors, including market fundamental events and technological developments, contribute to Bitcoin's price dynamics. This time around, the landscape surrounding the Halving Event is undeniably different, characterized by numerous vital factors that distinguish it from previous cycles.
Foremost among these differentiators is the advent of spot Bitcoin Exchange-Traded Funds (ETFs) in the United States, marking a significant milestone in Bitcoin's integration into mainstream finance. Introduced by prominent financial institutions, these ETFs have swiftly garnered attention and investment inflows, reshaping the market structure.
The launch of spot Bitcoin ETFs has been met with enthusiasm, evidenced by impressive net inflows totaling over $12 billion within a short span. While recent data indicates a slowdown in net inflows and a temporary outflow streak leading up to the halving, the long-term implications of these ETFs on Bitcoin's demand dynamics are profound. Consistent daily inflows into these products could provide significant support for Bitcoin's price, particularly as the rate of newly mined Bitcoin decreases post-halving.
With the Halving Event now behind us, what's in store for its future? Time will reveal the answer, but with these fundamental factors in play, one can't help but hope for the best. What do you think?

Oh Boy!Well this is it - BTC is right on the edge. Breakout, or failure?
The obvious falling wedge (bullish) that BTC has formed is seen on the chart marked by green lines. A breakout of this should be the final move into new ATH, and confirmation of the bull.
The red line is previous ATH.
Breaking this, and BTC shouldn't look back for many months to come.
It all hangs in the balance at this moment.
Hold on to your hats, one way or the other!

BTCUSD gearing up for big moveIn this chart you see a clean display of engineered liquidity above the current price.
For the past two months price action has been really boring, but some necessary moves where made. The liquidity below the price has been taken, which corrected the market in a healthy manner.
Now there's a very clean visual of liquidity above the current price. When Bitcoin starts its energetic move, it will be big. My targets are between US $84.000 and US $86.000.


$BTC stuck in the mud. My eye is on $53,700I am not a big fan of using trendline or channels for trading decisions. My strategy is in volume profiles & support/resistance.
But looking at BTC there isn't much happening as we sit in no mans land. I'd be interested in longing at 53.7k, and potentially firing a short at 75-77k, but with smaller size given there is no data at those levels.

Traders are betting on tomorrow's data to exceed expectationsWith the BOC and the ECB announcing interest rate cuts, the crypto market, as represented by BTC, has clearly turned stronger, with prices gradually climbing. Tomorrow's key macro data —— US Non-Farm Payrolls and Unemployment Rate have also become more interesting, with Fed rate cut expectations now at the center of macro trading.
Short-term IV is now clearly rising, with the weekly ATM IV back above 50%, but still below 50% at the end of the week, just as traders are betting on tomorrow's data to exceed expectations, with slightly stronger bullish forces.

Bitcoin BTC next possible moveThe Bitcoin CRYPTOCAP:BTC is currently forming a bullish flag and has formed an inverted Head & Shoulders pattern in the last few days. Now, I'd like to see how the price breaks through and re-tests the upper channel.
Then, I would consider adding more to my current position.

My view on BTCMy view on BTC in the following 4-12 weeks. We might see the new ATH at the end of July.

BTCUSDPair : BTCUSD ( Bitcoin / U.S Dollar )
Description :
Double Top Pattern in Long Time Frame
Break of Structure
RSI - Divergence
Completed " 12345 " Impulsive Waves and " A " Corrective Waves
Symmetrical Triangle as an Corrective Pattern in Short Time Frame

74.75K seems the nearest oneMorning folks,
So, as we've said, if BTC breaks 69K it should go higher. That we see now. Nearest upside target is based on the same pattern - reverse H&S that we're trading for a couple of weeks already.
It stands at 74.75K
But at the same time, I would like to show you this one - reverse H&S on top. If we see that BTC starts falling fast, it could be not the signal of reversal but the forming of the right arm. Just be
prepared to this scenario if BTC starts showing fast downside action.
For primary scenario (direct upward action to 74.75) we consider two support levels, where long entry might be interesting - 68K and 66.10K
We consider no shorts by far.

Bitcoin (BTC) Price Resurgence, Binance Coin (BNB) Hits a New HThe price of the primary cryptocurrency has been on an uptrend in the past few days, rising to as high as $71,700 on June 5. Currently, it hovers the $71,000 mark (per CoinGecko’s data), representing an 11% increase on a monthly scale.
The resurgence coincided with record figures related to spot Bitcoin ETFs in the USA. Those products witnessed a total inflow of almost $900 million yesterday, the second-best day since their approval in January.
Numerous analysts believe BTC could soar even higher in the near future, assuming certain factors are in place. The X user, Captain Faibik, predicted a rise above $90,000 should the asset surpass the “crucial resistance level” of $71,300.
On the other hand, Ali Martinez assumed that a pullback is not out of the cards based on the TD sequential, which presents a sell signal on the four-hour chart. This technical analysis tool identifies potential price exhaustion points in the market and indicates when a trend is likely to reverse.