BITCOIN FAIR PRICE (Upper) Until June 23. #BTCUSD : $71,375BITCOIN FAIR PRICE (Upper) Until June 23. #BTCUSD : $71,375
Overbought (sell signal) above: $73,068
Oversold (Buy signal) below: $69,682
BTCUSD.P trade ideas

I suspect a breakout is imminent Price has managed to hold this range for the past two weeks. Therefore it can said that there has been enough time for active sellers to sell. Spot flows are bullish. The perp market is not yet overextended.
It seems most probable that equilibrium is higher.

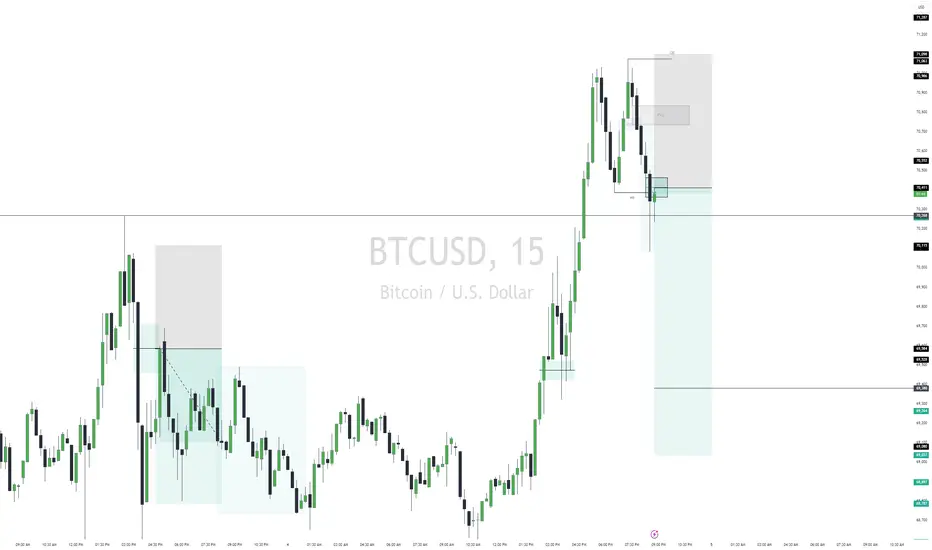
BTCUSD Sellwe are selling, looking at the chart we can see sweep of PDH and ARH we have displacement and IMB along with MSS we enter off the IMB and target 1:2 lets see how it goes.
BTCUSD Long: To the moon?Context:
Currently trading above previous high from Nov. 2021 with bullish FVGs on monthly chart - but we are now in a consolidation, but with upwards tendency. Same for the weekly chart - we just took out the previous week high.
Idea:
• Entry between prev. week high and prev. day high after 4h close above bearish FVG.
• Entry in mentioned area preffered with a lower timeframe setup like a reversal candle on 30min.
• Approach of the entry should be without FVGs on 30min. Otherwise wait for bearish 30min FVG to be closed.
Stop: Below your 30min entry setup
→ 1st TP: Around ATH / 73500
→ 2nd TP: trailing stop: "sky is the limit"
When does this scenario become invalidated? If the current 4h candle becomes a confirmed reversal candle. Then we could rally lower to at least 69000.

Bearish engulfing Candle patternLots of info how to trade this, just sharing here incase you missed it - food for thought

+4R Textbook trade breakdown☝️Do not act based on my analysis, do your own research!!
The main purpose of my resources is free, actionable education for anyone who wants to learn trading and improve mental and technical trading skills. Learn from hundreds of videos and the real story of a particular trader, with all the mistakes and pain on the way to consistency. I'm always glad to discuss and answer questions. 🙌
☝️ALL ideas and videos here are for sharing my experience purposes only, not financial advice, NOT A SIGNAL. YOUR TRADES ARE YOUR COMPLETE RESPONSIBILITY. Everything here should be treated as a simulated, educational environment. Important disclaimer - this idea is just a possibility and my extremely subjective opinion. Do not act based on my analysis, do your own research!!

Bitcoin (BTCUSD Coinbase) Cup and handle to 85k or chaos? This is a cup and handle and projected breakout should be around 85k. Our recent correction hit the .5 fib and bounced back up to 70k then hit 71k earlier Monday. This price action completed the handle of the cup. Bitcoin looks to be close to be pushing against the shorts and this should power the next big breakout. It it fails I think we drop down the the golden pocket between the .68 and the .65 fib and then we try breakout again.
As this all plays out this Bitcoin bull run has a huge headwind with traditional markets sputtering and seem to be in a topping formation over last year and a half. This adds a huge risk to Bitcoin and could crash the price if these markets start to tumble. This risk didn't exist in the past Bitcoin bull markets making this run unique. We will have to wait to find out the next moves as data becomes available. Cheers

BTCUSD - CUP AND HANDLE WEEKLY CHARTThis chart is only for educational purpose and it is not a recommendation for trading.
This study is only based on past chart patterns which have been studied by various technical analyst.

hey there elliotwave analysehello< i am targetting wave 3 around 130k will take profits there... have a nice one and stick to the plan what you made ;)

BITCOIN ( LONG )BITCOIN
Tendency the price is a long pressure in between 67,913 and 67.432
Turning level : The turning level between 67,913 and 67.432 so as long as the price above this level, there will be a bullish trend
resistance level : trade above turning level between 67,913 and 67.432 , the price will rise to 70,064 and 71,364, as long as price stabilize this level, will be reach a new peak
support level : braking a turning level67,432 the price will reach the support level of 66.028 and 64,689
corrective level : price will attempt between 67,913 and 67.432, correct itself before long

NEVER TRADE without ATRATR shows a good space to move up. My external source reads up. There’s an impulse which shows moving up and down but keeps aiming up.
Please be aware of any sudden movements.

Bitcoin's Bullish Surge Supported by Rising Open InterestBitcoin's Bullish Surge Supported by Rising Open Interest: $80K Next?
Bitcoin (BTC) is experiencing a bullish surge, fueled by rising Open Interest (OI) in the derivatives market. This strong showing indicates a growing optimism among traders, with long positions dominating the market. Let's delve deeper into this trend and explore what it might mean for the future price of Bitcoin.
Strong Hands in Control: The Rise of Open Interest
The derivatives market offers a glimpse into investor sentiment through Open Interest (OI). OI refers to the total amount of outstanding futures contracts that haven't been settled yet. In simpler terms, it reflects the future price movement. total value of bets placed on Bitcoin's
A recent surge in OI signifies a rise in trading activity and growing confidence among investors. This is precisely what we're witnessing in Bitcoin's market. As of June 4, 2024, OI has reached 17.89 billion, demonstrating a significant increase over the past week (5.98%) and even within the last 24 hours (0.06%).
Bullish Sentiment: Longs Take the Lead
The dominance of long positions in the derivatives market is another key indicator of bullish sentiment. Long positions represent traders who believe the price of Bitcoin will increase. Their willingness to pay premiums to short sellers (those betting on a price decrease) further strengthens the bullish case.
This current trend suggests that investors are generally optimistic about Bitcoin's future prospects. They are placing their bets on a price rise, injecting confidence into the market and potentially propelling the price upwards.
Increased Liquidity, Volatility, and Attention
The rise in OI is accompanied by a rise in liquidity, volatility, and market attention. Increased liquidity makes it easier for traders to enter and exit positions, promoting smoother price movements. Volatility, while it can be risky, also indicates market vibrancy and can attract new investors seeking potential gains.
More importantly, the surge in OI reflects heightened market attention towards Bitcoin. This increased scrutiny places Bitcoin in the spotlight, potentially attracting a wider range of investors and further fueling the bullish momentum.
Can Bitcoin Touch $70,000?
With the current bullish trend and rising OI, Bitcoin appears poised to break through key resistance levels. The $70,000 mark, once a distant target, now seems within reach. However, it's important to remember that the cryptocurrency market is inherently volatile, and unforeseen events can trigger price corrections.
A Word of Caution
While the current market conditions are encouraging for Bitcoin bulls, investors should always exercise caution. The cryptocurrency market remains unpredictable, and past performance does not necessarily indicate future results.
Conducting thorough research, employing sound risk management strategies, and maintaining a long-term perspective is crucial before entering the Bitcoin market.
Conclusion
Bitcoin's recent surge, coupled with rising Open Interest in the derivatives market, paints a bullish picture. The dominance of long positions increased liquidity, and heightened market attention are positive signs for the world's leading cryptocurrency. While the $70,000 target appears achievable, cautious optimism is warranted due to the market's inherent volatility. By carefully evaluating market conditions and implementing strong risk management practices, investors can position themselves to potentially benefit from this exciting chapter in Bitcoin's ongoing story.

ON-BALANCE VOLUME-Possible Target $70,378OBV green trend lines has been confirmed by OBV. For that reason they are aligned that way. The dotted arrow points to the top according to halving.
Follow the white moving average which refers to price guidance. Indeed candlestick trend moved downwards as price guidance and now points to the upside
Possible Target $70,378

Prince Range Questionable I’m short selling BTC since it’s been in Chaos during this 2MO TF. Theres no way of telling where the trend will end up. It’s very volatile.
My new strategy is following smart money buying and selling. For now this is best way to go for me until BTC reestablishes.
I have prices in mind but my main focus is following the buys and sells from the bigger traders.
Soon I’ll have my own software to detect smart money spoofing. Meantime I have my own separate smart money movements with buys and sells.
GREEN RECTANGLE is BTC price range. Reads minimum FWB:65K zone. If I’m told to sell, I’ll update even if it doesn’t hit target.
Once I’m able to detect spoofing, I’ll later have more information based on accurate price range.

BREAK ALL THE RULES: SPYING smart money trend lines Traced over smart money trend movements. Two circles represent hidden secret smart money double bottoms. Not revealed to the public. They must meet an algorithm.
How high, for now it’s questionable.
Breaking all the rules: whales break rules, so will I.
Stay tuned for buying and selling updates. Once I can confirm BULL-SHARKS BUYING entry, I’ll update.
I’m working on whales buying and selling algo.

SMART MONEY CONTRACTIONS: MUST SEE Smart money contractions. Please view possible BEAR dip to within the value line. OB reads $61k to $62k.
BULL contractions will play its role. View smart money possibility zigzags.

BITCOIN You might not be ready for such June!Bitcoin (BTCUSD) is doing it and yet again it is going under the radar for some. The price broke out yesterday from its short-term Falling Wedge and as we showed you is extending the Bullish Leg of the Channel Up.
Zooming out to the 1M time-frame, we can see that May closed in gains (green) and since August 2023, there has only been one month of losses (red 1M candle) and that was April. Even though that injected some uncertainty to market participants, we clearly see on this long-term chart that sporadic 1 month losses are very common in Bull Cycles, especially during parabolic rallies.
In fact they are essential as they create the right shake-out conditions to keep fueling the rally. The symmetry among BTC's Cycles is remarkable and right now with the 1W MA50 (black trend-line) in deep support, it is attempting to get detached from the Mayer Multiple (MM) 1 SD above (grey trend-line), much like it did on October 2020 and April 2017.
Based on that, we are looking for the rally to extend to at least the end of the year and reach a Target Zone within $150k - $200k within MM 2 and 3 SD above (orange the red trend-lines respectively). Last but not least, take a look at the 1M RSI, which is also on a symmetry with the previous Cycles and once it touches the Lower Highs trend-line, we should consider to start taking profits regardless of whether of the range the price might be at the time.
But what do you think? Are you prepared for a 'hot' June and if yes, how high do you think BTC will go? Feel free to let us know in the comments section below!
-------------------------------------------------------------------------------
** Please LIKE 👍, FOLLOW ✅, SHARE 🙌 and COMMENT ✍ if you enjoy this idea! Also share your ideas and charts in the comments section below! This is best way to keep it relevant, support us, keep the content here free and allow the idea to reach as many people as possible. **
-------------------------------------------------------------------------------
💸💸💸💸💸💸
👇 👇 👇 👇 👇 👇

WHALE ENTRY's5 candlestick blocks. Price prediction to $70,883. I'm testing this new strategy. Smart Money Value line. Trend passes the contraction value line. The next contraction is around $72k zone.

BTCUSD long movePrice had broken our resistance level and hence am expecting a retest before the price cloud finally move upside towards the target area.

BITCOIN UPDATE ! NEXT STOP $80,000 ?REVIEW BITCOIN
After a life-long accumulation #BTC FINALLY looks ready for expansion! We got everything we desired: solid breakout of a bullish flag, multiple retests, and another breakout of a small wedge 🤯
The target is price discovery. Great time to hold #BTC IMO!
#CRYPTOEASE
BINANCE:BTCUSD

Bitcoin on the Brink of a New Bull Run Post-HalvingBitcoin's price has begun to surge once again, indicating a potential new bull run following its recent halving. The price action is currently within a bullish channel, and technical indicators combined with Fibonacci ratios suggest the onset of a fresh bullish impulse.
The Halving Effect: A Catalyst for Price Appreciation
On April 19, Bitcoin underwent its fourth halving event. These halvings, which occur approximately every four years, are integral to Bitcoin's monetary policy. They aim to maintain scarcity by halving the inflation rate, which has now dropped to just 0.85%—a lower rate than that of gold, often deemed the ultimate store of value and inflation hedge.
Over the long term, the reduction in Bitcoin's inflation rate is expected to drive price appreciation. As demand for Bitcoin increases, the limited supply of 21 million coins will face increasing pressure, creating significant potential for price rises.
Even in the short term, the halving effect enhances Bitcoin's attractiveness as an investment. Historically, Bitcoin's price has risen by an average of 125% in years when a halving occurs. This suggests that, starting from the beginning of the year, Bitcoin's price could potentially exceed $100,000, offering substantial returns given the current price around $69,000. Furthermore, Bitcoin's best performance typically happens in the year following a halving, with historical gains exceeding 400%.
Significant Institutional Interest and Bitcoin's Role in the Financial Landscape
For much of its history, Bitcoin's rise has been driven by retail investors. However, this dynamic is set to change significantly. The approval of spot Bitcoin ETFs has made it easier for institutional investors with vast capital reserves to invest in the cryptocurrency. This influx of major Wall Street players is likely to exert unprecedented pressure on Bitcoin's finite supply, echoing its early days of high demand.
The approval of a spot Bitcoin ETF also reflects the market's current perception of Bitcoin and its role in the financial ecosystem. In contrast, Ethereum (ETH), the second-largest cryptocurrency by market cap, faces ongoing debates over ETF approval as regulators determine whether it is a security or a commodity. This regulatory scrutiny extends to all cryptocurrencies, creating uncertainty about their classification.
It's crucial to note that an SEC classification of a cryptocurrency as a security does not spell the end for that blockchain. Many of these assets are highly decentralized and would continue to operate even if faced with litigation from the SEC. Cryptocurrencies are traded globally and are not confined to the laws of any single country.
However, regulatory risks are a significant concern for markets. Bitcoin stands out as a relatively safer investment in this regard. The SEC has already classified Bitcoin as a commodity, placing it outside the agency's regulatory control. This classification grants Bitcoin unique staying power and a degree of protection against regulatory scrutiny.
Bitcoin's current bullish trend, supported by the recent halving and growing institutional interest, sets the stage for potential substantial price appreciation. The reduced inflation rate and increasing demand create a strong case for Bitcoin's long-term value. Meanwhile, its classification as a commodity provides a safeguard against regulatory risks, further solidifying its position as a leading asset in the cryptocurrency market.

The journey to 100k per Bitcoin starts today- complimentary analysis to my last one:
- btc displaying a textbook retest of a giant, multi-month bull flag
- 5d volatility at rock bottom supports a +40% move
Fundamentals have never been better:
1. ethereum ETF has been approved and is about to go live soon
2. Trump publicly supporting crypto & crypto holders
3. the chances of a surprise June rate hike are much higher than most people expect
100k - the magical number.

BTC Preparing to Test the MACRO Descending Channel It has been a glorious battle of the Bears and Bulls this past week. BTC has been moving well inside of its newly developed flag and preparing to test the MACRO descending channel. If price breaks above channel and holds, BTC may be on its journey to test the ATH. If price gets rejected that will be our signal that the battle continues and the bears are not ready to submit. COINBASE:BTCUSD
