BTC Hourly Update.BTC Update:
BTC is standing strong at $67.3k where we have the 200EMA and the supporting trendline. We are likely to see a bounce toward $70k once again.
Resistance: $70k.
Support: $67.3k.
BTCUPUSDT trade ideas

Bitcoin is going to shoot up to $112k+ in June / JulyAll details are drawn on the chart.
Basically BTC is in a huge bull market with a clear imbalance of demand and supply. There was 3-month long reaccumulation period at all time high of $69500 with all outstanding supply bought up. Price is gonna shoot up to $112k at minimum very swiftly.

Bank Time BoiNew Update: I knew there were two bounces, I just didn't realize the first one would make an all-time-high only to meet its old bottom at 20ish k. Here's the crazy part -- it won't close below 50k. Good luck ya'll. CYA at the bank

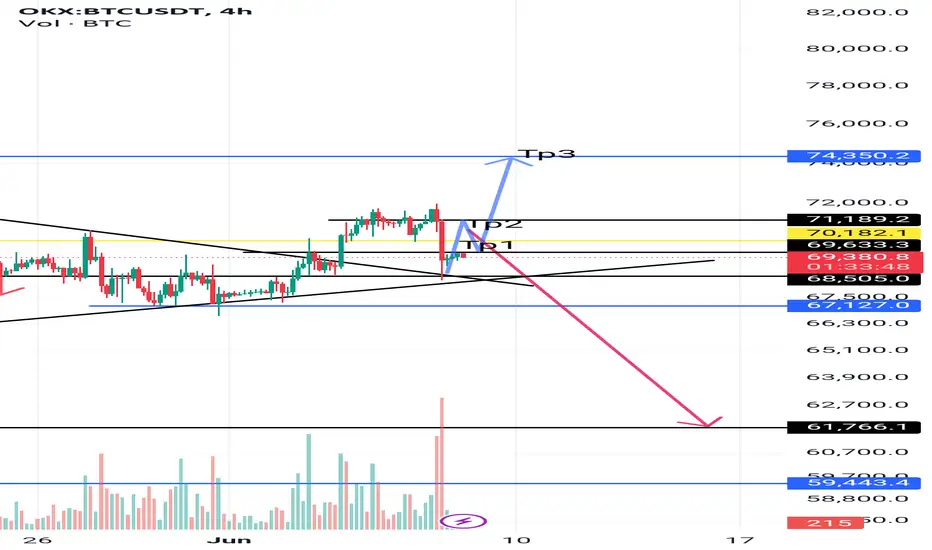
Btc4hBitcoin can climb from the current point to targets 1 and 2, and from there it must decide whether to break the ceiling or go down to 61,000.
"Bitcoin and BTC Dominance Analysis: Breaking 70k and a Pump?"💹 Let's dive into the analysis and review of Bitcoin, which has been making a lot of noise lately, and implement this new program in our channel.
🌟 Unfortunately, today, two of my good analyses on DOGE and TON got deleted from the channel due to some issues on my part. I will fix these problems and repost them for you. Because of this, a new idea came to my mind.
🏆 From this week, we will have a new schedule:
😊 Monday: Bitcoin and Bitcoin Dominance Analysis , Tuesday: Gold Analysis , Wednesday: Ethereum and Ethereum vs Bitcoin Analysis
This will be in addition to our daily analyses, and we will update them together every week.
📈 Weekly Timeframe Analysis:
In the past week, nothing significant has happened on the Bitcoin chart, and it has merely been fluctuating between the box of 71468 to 67185, which is completely natural. In my opinion, it's trying to tire people out and gather liquidity for the next move.
📅 Daily Timeframe Analysis:
On the daily timeframe, our situation is clear. Within the boxes, we take long positions when the box ceiling is broken and short positions when the box floor is broken. We do not expect high risk-reward ratios inside the box. Which way will this daily box break? I don't know because I'm not a fortune teller, but since we made a fake breakout from the box floor, the probability of breaking the box ceiling is slightly higher.
📈 Weekly Timeframe Analysis Continued:
On the weekly timeframe, however, we are completely bullish. After hitting the 71468 resistance and a short-term correction, we are moving back towards this resistance. If the volume increases, we can expect a potential break of this ceiling and new ATHs. Also, in this timeframe, if our RSI breaks the 70.15 line, it can be a confirmation of the continuation of the trend, but it is better if the volume is also increasing.
💰 Long-term Investors:
For long-term investors, I suggest being patient and at least waiting until we stabilize below 60648 and break the box floor. After the break, review your altcoins. We will also talk about dominances after the 4-hour timeframe analysis.
⏳ Four-hour Timeframe Analysis:
On the 4-hour timeframe, our trigger for short positions is clear: after breaking the 67185 support, we can open short positions, and after breaking the 71468 trigger, we can open long positions.
🛠️ Short Position Strategy:
For short positions, because we are moving back into the box, try to set small but logical stop losses and exit quickly in your risk-reward zones. For long positions, when approaching the 71468 resistance, even setting a stop buy order using your exchange's order book is logical because we might see a sharp move and break the box ceiling. You can consider RSI entering the overbought zone as a sign.
📊 Bitcoin Dominance (BTC.D) Analysis:
Regarding Bitcoin Dominance (BTC.D) or the percentage of Bitcoin's market cap relative to the total crypto market cap, it’s not always viewed from a buyer or seller perspective but can be analyzed. When Bitcoin is moving up and BTC.D is also moving up, it's clear that opening positions on Bitcoin will yield more profit, except for some coins that are also bullish against Bitcoin pairs. For example, if ADABTC is bullish, ADAUSDT will also give us a reasonable percentage profit and move more than Bitcoin.
📈 BTC.D Trend Analysis:
If Bitcoin is moving up but BTC.D is showing red candles, we try to open long positions on altcoins. You can always open positions on Bitcoin, but if you are looking for more movement and higher profits, checking BTC.D will not disappoint you. After breaking 54.71%, we can move upwards with mid-term resistances at 55.15% and 55.71%.
💡 The previous Bitcoin candle had decent volume. I suggest setting alarms and staying behind the chart. Don’t just come in after the move is over to take profits from others :)) Wishing you a great week ahead!
🔮 Key Support and Resistance Levels:
Support Levels: 67,185, 64,512
Resistance Levels: 71,468, 73,438
😊 If you'd like me to analyze a specific coin or currency pair, be sure to comment so that I can allocate the next analysis for you!
⚠️ Also, please remember that I'm just an analyst, and this isn't financial advice. We're here to stay in the market and maximize profits by adhering to risk and capital management principles.

Chart Pattern Analysis Of Bitcoin
K3 break up and close upon K2 under low supply pressure,
It seems that the following candles will price up to test the resistance.
I don’t think this is the start of another bull run,
It is just a Wave(B) of a larger scale consolidation process.
But during this process,
Some other crypto tokens will do better.


Bitcoin: Will Low Volume Push Price to $61,000?Bitcoin (BTC) has lost momentum over the past two days, raising concerns among analysts, and traders. The leading cryptocurrency is currently trading sideways, lacking the strong volume needed to break through key resistance levels.
Low trading volume often precedes price dips, and if we don't see a surge in buying pressure soon, we could see Bitcoin revisit the $61,000 area.
The $63,000 price point has proven to be a significant hurdle for Bitcoin in recent weeks. Without a significant increase in trading volume, I believe a price correction towards the $61,000 support level is a strong possibility.


Bitcoin - Reaccumulation or Distribution IIIMacro Perspective: Bitcoin is still in a Wyckoff accumulation/distribution schematic.
Medium-Term Bias: The Sideways trend is expected to continue until Bitcoin either makes a Lower Low (LL) or breaks above 74K and flips it to support. This process is projected to unfold by October 24.
Because of Bitcoin’s lackluster PA and time factors, I am leaning towards distribution.
In the short term, there are two distinct scenarios that could potentially unfold, each with its own implications for Bitcoin's price action:
1. UTAD. Bitcoin is still holding the trendline and the 69K support. In that respect, it can still try for a UTAD. Following the UTAD, I expect a swift decline to the range low.
2. Should Bitcoin fail to hold the trendline, Bitcoin will find support between 67.8K, which is the range PoC, and 67.3K, which is the mid-range. Then, the trendline will flip to resistance and Bitcoin will drop to the range low. If this scenario materializes, look for bearish divergences as a confluence factor for a short trade.

Bitcoin/TetherUSHello and respect to the honorable traders,
today we are examining the continuation of Bitcoin analysis. Previously, we mentioned that Bitcoin will experience an upward movement and then a pullback. According to Smart Money Concept analysis, this scenario is likely to be valid, and we are currently continuing the analysis. Bitcoin is likely to have a short pullback to the specified range and with the start of its downward trend, it will reach the $50,000 range.

Manage your risk! My next trade🚨In todays video we talk about:
the importance of risk management as a fundamental pillar in trading
the global outlook on bitcoin
the local outlook on bitcoin
potential setups: sweeps of the internal range highs
Follow for more

BTCUSDT to hit resistance around 70.5k and drop towards 67k Here is a new short trade idea. The price has been pushing up after the last big drop around 5 percent. The price found support around 68.5k zone and since then it is pushing up slowly. This push has been really slow and likely to reach till the low TF resistance LTFR1. I expect that the resistance there would make the upward push of the price to stop and then push it downwards. This rejection of the price at that resistance level will lead the price to look towards the next support on its way down. The next major support is weekly support around 66.7k-67.7k. Therefore, a short trade favorable from there towards weekly support WS1 around 67k.

Monitoring a New Hash Ribbons SignalNine months ago, we observed a remarkable signal that led to a 14% decline followed by a 190% increase. Today, we have another signal pending confirmation.
The Hash Ribbons is a technical indicator developed specifically for Bitcoin by Charles Edwards. It uses the network's hash rate and its moving average to generate potential buy signals. This indicator is widely regarded as a representation of the fundamental health of the Bitcoin network and has been adopted by many traders and investors to identify potential buying opportunities.
How Does the Hash Ribbons Work?
The Hash Ribbons combine two moving averages of Bitcoin's network hash rate: a short-term moving average and a long-term moving average. When the short-term average crosses above the long-term average, a buy signal is generated. This signal is often represented by a blue arrow or dot on the chart.
Historical Analysis of the Blue Signal:
Examining historical data, there is a compelling trend associated with this particular signal.
- On the Weekly Chart : The blue signal appeared on August 7, 2023. Historically, out of the last 14 occurrences of this signal on a weekly chart, Bitcoin's price increased 13 times.
- On the Daily Chart : The blue signal was observed on August 12, 2023. Overall, this signal has shown up 19 times on the daily chart. Intriguingly, out of these 19 occurrences, Bitcoin's price decreased only once following the signal's emergence.
Conclusion:
If historical trends are any indication, the Hash Ribbons signal offers a high probability of bullish movement for Bitcoin. Of course, as with any technical indicator, it is crucial to use the Hash Ribbons in conjunction with other tools and analyses to make informed decisions.
It is also essential to remember that past performance is not indicative of future results. However, the historical data associated with the Hash Ribbons clearly shows it is an indicator worth closely monitoring for potential Bitcoin buying opportunities.
I will continue to keep a close watch on this indicator, which has proven to be highly profitable in the past.

Sell BitcoinBitcoin has made another lower high, there's an opportunity to sell with a stop just above the last high

BTC Price Prediction and Elliott Wave AnalysisHello friends,
Thank you for joining me in my analysis. Remember to like, subscribe, and stay tuned for more updates. See you soon!
Thanks, Bros

bitcoin monthly chart without log trying to give progress of bitcoin using monthly chart without using log as done in previous idea

BTC:POTENTIAL INVERSE HEAD AND SHOULDER FORMATION!!Hey everyone!
If you're enjoying this analysis, a thumbs up and follow would be greatly appreciated!
Bitcoin (BTC) Update:
BTC is forming a bullish inverse head and shoulders pattern on the daily timeframe. The price is currently attempting to break above the neckline, which could signal a significant price increase.
Here's what we're watching:
Confirmed breakout: A clean break and close above the neckline is key for this pattern's validity.
Price target: If the breakout is confirmed, we could see a rally of 20-25%, potentially reaching $85k-$90k.
Let me know your thoughts in the comments below!

Heavy Breakout Toward a 75k And 84k Is Coming At High Time Frame The Main Formation For The Bitcoin Is a Bull Flag Included ABC Corrective Pattern ,Which Wave C Completed At The 56k Zone By The Classical Inverse Head And Shoulder Pattern
Currently The Price Playing Below The Important Trend Line And My Expectation Is a Heavy Breakout Toward a 75k And 84k In a Short Term

IS ALL LOST? BTCIt's always funny when BTC make a correction and most of the traders start screaming about a big drop. Correction, as I always said, are good and healthy. Bitcoin has just made a good correction and has liquidated some long positions, considering the euphoria phase. Now, I hope it can give us a good entry from $65.700/66.100, that's a support zone and a good liquidity point to reach. From there, Bitcoin can probably start a new run, maybe in the next weeks, that could give us new all time high

ATR supportBTC is in a period of extremely low volatility, often succeeded by periods of high volatility.
Looking at the average true range indicator, the last two times btc was at that ATR support level, it went 30~% + in 10~ days.
If the rest of the markets are not falling ( snp ), btc should hit 90k$~ by 21st (in 10 days~ )
We are post halving, at the start of the next bubble. Extremely bullish!

BITCOIN BIG SHORT IS COMING SOON ( 90 % down from 71000 $ )Bitcoin has completed first leg and second leg and now third leg plays in to close the bullrun cycle and drop till 9000 $ or 6666 $ to complete its cycle .

BTC - Short-term View!Hello TradingView Family / Fellow Traders. This is Richard, also known as theSignalyst.
📈 BTC has been overall bullish, trading within the rising channel in blue.
Currently, BTC is undergoing a correction phase and it is currently approaching the lower bound of the channel.
Moreover, it is retesting a structure and trendline in red.
🏹 Thus, the highlighted blue circle is a strong area to look for trend-following buy setups as it is the intersection of the red structure and lower blue trendline acting as a non-horizontal support.
📚 As per my trading style:
As long as the red support zone holds, I will be looking for bullish reversal setups (like a double bottom pattern, trendline break , and so on...)
📚 Always follow your trading plan regarding entry, risk management, and trade management.
Good luck!
All Strategies Are Good; If Managed Properly!
~Rich
