the bigger picture....this is the BTC bigger picture however we need to be patient in order to see the real direction of the market
BTCUPUSDT trade ideas

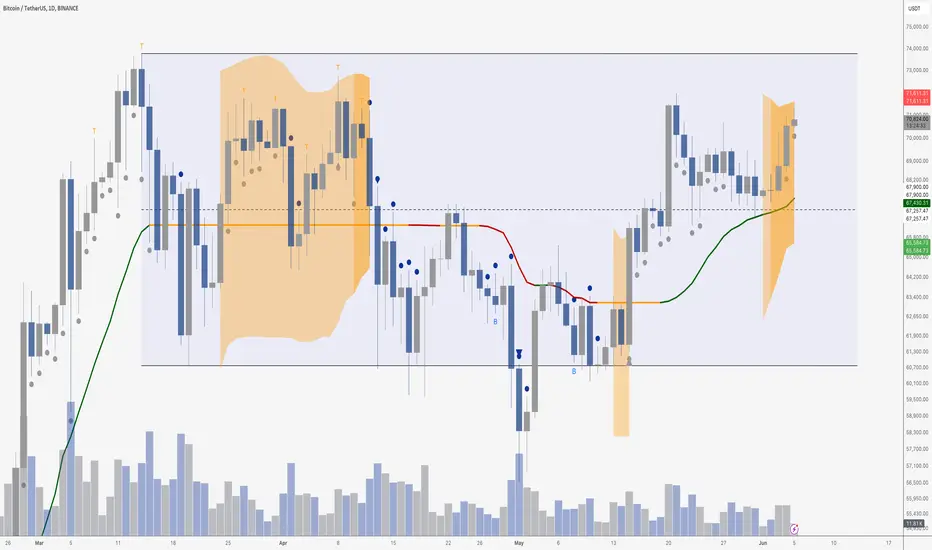
Bitcoin LiquidationBitcoin Liquidation
there is Short & Long Liquidation price on binance
I look about the liquidity prices there is a huge liquidity
Long Liquidation red line's
68350
66650
Short Liquidation long line's
81000
74100

BTC Bullish Fractal TriggeredWilliams bullish fractal has been triggered, I think its time to look for longs. Possible targets, by using the 10k bull run.

BTC: Bull Pennant forming! Previously, the price formed an inverse Head & Shoulders pattern and broke the neckline to the upside. Now, it is consolidating in a bull pennant pattern, indicating a high probability of further upward movement. If the price breaks the resistance zone, reaching 80k is likely.
Currently, attention is on the DXY and S&P500. If the DXY continues to decline, a new ATH for both the S&P500 and BTC is expected. Therefore, monitoring the DXY is crucial to anticipate BTC's next direction. For now, the DXY has been declining, so a bullish move for BTC could be imminent!

📈 Correction Is Done And BTC About To Hit The New ATH📥 Last Night We Had a Hard Rejection From The Trend Line And It Caused The Dump To The 67k Support Level As a 2.618% PRZ And I Named It As a Wave C Low
📈 Currently Clear Bull Flag Formed At The Chart And The BTC Playing Below It And This Time I Expect a Breakout Toward a 75500$ As a Next Target
👉 Totally By Last Night Dump I Think The Correction Is Over And The BITCOIN Is Ready To Hit The New ATH

Bitcoin (BTC) Market UpdateCurrent Situation:
Yesterday, Bitcoin saw a 4% move to the upside, igniting the rest of the market. If this trend continues, we could be in for a very strong month.
Resistance Levels:
Major Resistance: $72,000 (bottom of the range area acting as major resistance)
All-Time High: $73,800
Next Resistance: $76,000
Market Dynamics:
Short Squeeze Potential: Many short BTC traders have their stop-losses just above $72,000 and even more above the all-time high of $73,800. If the price starts triggering those stops, it could cause a cascade effect, pushing the price higher as short traders cover their positions by going long.
Bullish Breakout: A move above the all-time high of $73,800 will likely trigger significant bullish momentum, potentially driving the price to $76,000 or higher if a massive short squeeze occurs.
Impact on Altcoins:
Bullish Sentiment: A breakout above the all-time high will be very bullish for the broader market, especially for altcoins, which have been lagging in recent months.
Trade Strategy:
For Bulls: Watch for a breakout above $72,000 and $73,800 for potential long opportunities, targeting $76,000 and higher.
For Bears: Be cautious of potential short squeezes and set stop-losses appropriately above key resistance levels.
Stay vigilant for market movements and ready to capitalize on potential bullish trends.
#Crypto #Bitcoin #BTC #MarketUpdate #ResistanceLevels #ShortSqueeze #BullishTrend #Cryptocurrency #Trading #Blockchain

BTC Trend Line Supports & ResistanceBTC Trend Line Supports & Resistance
BTC USDT will step downward backwards from 72,000$ soon.

BITCOIN TO $74,000?Bitcoin continues to push towards the range high, around $74,000. As you know by now, once price broke into the upper half of the range, the expectation is a visit to the top. At that point, we will be at resistance and people will be losing their minds with bullishness. The reason charts work is because of humans - they get bullish at resistance and bearish at support.
We need to see a clean break of the all time high on real volume to indicate that all of this is anything but chop… but chop near the highs is much more fun than chop near the lows.
Everything still look great.
BTCUSDT LONG Day chart view shows uptrend continues low time frame also looking upside breakout completed ...
1:2 RR use proper MM

Bearish divergence of $BTC price#bitcoin #btc price has formed a bearish RSI+ Stoch+ MACD divergence in lower time frame. Minor correction may be necessary. Not financial advice.

BTCUSDT | 15M FALSE BREAKOUTExciting movements on BTC today! The last two 1-hour candles were intriguing, showing some notable volume. On the 15M timeframe, we broke the low and then bounced back up. With a false break on the 1H timeframe, we might see a retest of the 15M low. This sets up an interesting opportunity to go long. I've set my order—let's see how it plays out!


IT'S PLAYING MY GAME BTCI don't know if you remember the previous idea i shared about Bitcoin. As you can see, BTC price has perfectly followed my line. Actually the price has broken above the main daily trend line as i was expecting. IMHO we will see a little correction there that will lead It inside the triangle again and the real pump should start next week/Friday.

BITCOIN CHART UPDATE !!Hello friends, welcome to this BITCOIN update from Crypto Sanders.
#BTC/USDT Analysis
The crypto market has entered a strong bullish rally following the successful breakout and subsequent retest of the symmetrical triangle pattern. This rally faces horizontal resistance, a crucial level influencing short-term price movements.
Symmetrical Triangle Pattern: The breakout and retest of this pattern have led to the current bullish rally.
50-Day Moving Average: This moving average is moving upwards, indicating ongoing bullish momentum and acting as a dynamic support.
Resistance: Bitcoin is facing horizontal resistance. A decisive break above this level will further validate the current bullish sentiment.
Support: The 50-day moving average is providing dynamic support, reinforcing the upward trend.
If Bitcoin breaks above the horizontal resistance with strong volume confirmation, consider entering a long position. This move could lead to continued upward momentum and new highs.
Place a stop-loss order below the 50-day moving average or recent support level to effectively manage risk. Summary: Bitcoin (BTC/USDT) is showing strong bullish momentum after the breakout and retest of the symmetrical triangle pattern. The current rally is facing horizontal resistance, which is a crucial level for short-term price movements. A decisive break above this resistance could lead to continued upward momentum and new highs, while the 50-day moving average provides dynamic support. Stay tuned for further updates and analysis.
I have tried to bring the best possible results in this chart.
If you like it, hit the like button and share your charts in the comments section.
Thank you.

#BTC bullish cup-and-handle structure📊#BTC bullish cup-and-handle structure📈
🧠From a structural point of view, we have successfully broken through the turning point, which means that the bullish structure of the cup and handle has been established. It is reasonable to use the bullish structure as a supporting force to continue the upward trend in the future.📈
➡️From a morphological perspective, the ascending triangle is established.
⚠️But we need to be clear that we are currently in the red target zone, so we cannot chase the rise. If there is a good correction and the price reaches the buy zone, it will be a long trading opportunity worthy of our attention.
Let's see if the market can give us such an opportunity.👀
⚠️Don’t forget risk management💯
✔️Trade safe✔️
🤜If you like my analysis, please like 💖and share it
👋follow me. Learn about further structural evolution💕
BINANCE:ETHUSDT.P

BITCOIN - Price can continue to fall to support level in flatHi guys, this is my overview for BTCUSDT, feel free to check it and write your feedback in comments👊
A not long time ago price entered to wedge pattern, bouncing down from resistance line and breaking $62200 level.
But then, BTC made upward impulse to $66600 level, breaking $62200 level, and even soon broke $66600 level too.
Next, price continued to move up and in a short time later exited from wedge and even entered to resistance area.
After this, Bitcoin turned around and started to trades in flat, making a fake breakout of $70700 level.
Recently price fell to support level, but then bounced up and now it tardes almost near top part of flat.
At the moment, I think price can make upward movement first, and then continue to fall to $66600
If this post is useful to you, you can support me with like/boost and advice in comments❤️


Wave 4 of Bitcoin: Structure of a FlatHello dear friends, I hope you are doing well.
It took a long time to identify the structure of this prolonged sideways movement. I watched many videos and referred to my notes, and this has been very helpful.
The current wave structure in which Bitcoin is moving sideways is a flat pattern. This structure typically occurs in Wave 4 of Elliott Waves.
What is a Flat?
A flat is a corrective wave pattern in Elliott Wave theory that consists of three phases labeled as ABC:
------------
- Wave A consists of 3 waves.
------------
- Wave B consists of 3 waves.
------------
- Wave C consists of 5 waves.
------------
In general, the movement pattern of this structure is 3-3-5.
------------
After the pattern is complete, a breakout to the upside usually occurs (since Bitcoin was in an uptrend before this).
Sometimes this pattern can combine in a double or triple formation, which we will review below:
Double Flats:
Double flats can be divided into three categories:
1. Flat + Flat
2. Flat + Zigzag
3. Flat + Triangle
--------------
To connect them, an X wave is needed, which also has a 3-wave structure.
--------------
Conclusion:
If the top of this flat is broken, Wave 5 movement will begin. If the top is not broken and the correction continues, it means this upward movement was Wave X, and we should expect a larger flat, zigzag, or triangle pattern.
Once the structure is identified, the chart will be updated.

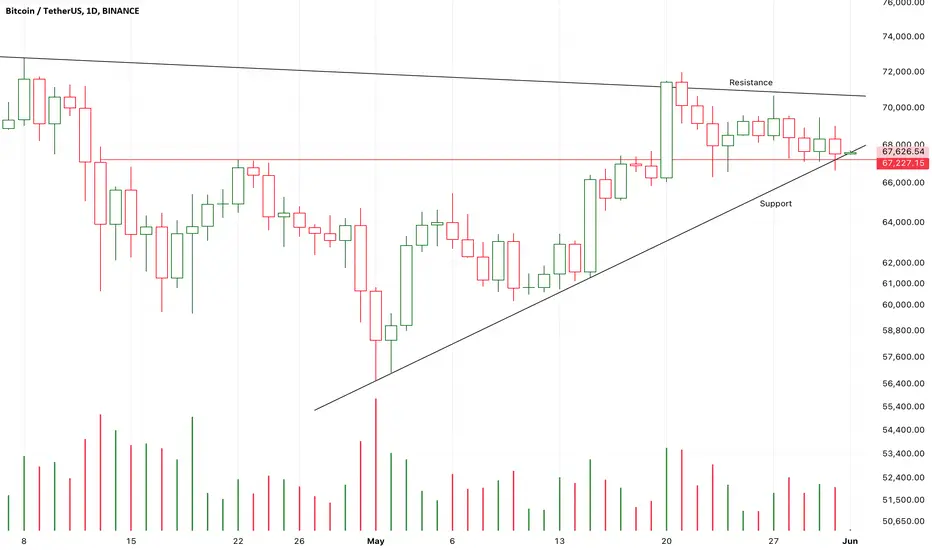
Chart Pattern Analysis Of Bitcoin
Trend Analysi:
From the chart, we can see that after experiencing a downtrend, Bitcoin's price is currently in a relatively stable consolidation range.
The recent price action shows Bitcoin fluctuating between $67,000 and $70,000. Although there have been several attempts to break through $70,000, they have all failed, and the price is currently around $67,650.
Support and Resistance Levels:
Support Level: The current support level is around $67,000, which is a strong support area. If the price breaks below this support level, it may further decline to around $60,000.
Resistance Level: The main resistance level is around $70,000. If the price can effectively break through this resistance, it may usher in a new round of upward movement.
Candlestick Patterns:
The recent candlestick patterns show a few bullish candles, but overall, the price movement is not significant, indicating market hesitation.
Observing the trading volume, we can see an increase in volume in recent days, indicating increased market activity, which may suggest a significant price movement ahead.
Conclusion
Combining the above analysis, Bitcoin is currently at a key support level, and the increase in trading volume indicates higher market activity. If it can hold above $67,000 and show signs of breaking upwards, it may be considered a good point to start building a long position. However, close attention should be paid to market movements and volume changes to prevent risks if the price breaks below the support level.
Operational Suggestions:
Aggressive Investors: Can start building long positions around $67,000, with a stop loss set below $66,000.
Conservative Investors: Wait for the price to break and hold above $70,000 before entering a long position to confirm the upward trend.
Please proceed with caution based on your personal risk tolerance and market conditions. It is advisable to combine this with other technical indicators and market information for comprehensive analysis.
🔥🔪 Pattern "Cap" | Gravitational waves📣 Hello everyone!
I bring to your attention my long-term trading idea for Bitcoin. The idea is based on the theory of wave price fluctuations and physics. Price movement with variable acceleration generates gravitational waves, lines of force form extrema.
Also, in this trading idea, to make it easier to understand, for the first time I introduce a long-term bearish pattern, which I simply called “CAP”. You are unlikely to find anything like this in books, since this is my personal term. It vaguely resembles a round top, but the internal structure is completely different.
1️⃣ Technique:
🔹 Fibonacci ratios are not observed throughout the entire uptrend
🔹 With great difficulty, you can highlight a stretched impulse wave, neglecting all possible standards.
🔹 Alternation between waves 2-4 is not observed.
After conducting a deep analysis of the entire upward trend from November 2022 from the point of view of the classical VTE, I came to the conclusion that it has not been applicable to the BTC price chart for the last year and is not working as it should.
You can try to pull the classic Elliot onto this trend as much as you like, but you will always have much more alternative scenarios than you would like.
There is one simple logical explanation for this - the Bitcoin chart has evolved and moved away from classical technical analysis over the past year, in particular from the generally accepted Fibonacci ratios and the classical Elliott wave theory. Everything is done in order to confuse traders as much as possible and as few people as possible make money on this instrument, and on the cryptocurrency market as a whole.
👉 Conclusion: I believe that all the upward movement, the entire growth of BTC from November 2022 DOES NOT HAVE AN IMPULSE STRUCTURE, which means that this entire movement automatically becomes a correction, so that there is nothing inside. This is extremely important.
2️⃣ Fundamentally
I am a technician and in 95% of cases I consider the price chart first. Only some strong fundamental sudden events can unexpectedly hurt; everything else is already on the schedule.
So, making such a prediction in anticipation of the BTC halving in 2024, I thought about what could happen so that the Bitcoin price does not update its ATH and collapses to $10,000? - After all, after the start of a movement, the fundamental is magically located on the technical picture, and it can be anything that you didn’t even suspect before, and neither did I, when making a trading idea. I've been through this dozens, if not hundreds of times over the past 7 years in crypto.
In fact, the reason for the increase in the price of Bitcoin now after the adoption of spot BTC-ETFs is the cyclicality and halving of BTC. No matter how much they have distorted the history of BTC, what they have not drawn on price logarithmic charts, but the essence is the same - these are the expectations that this time everything will repeat exactly the same as it was in the past - growth after the BTC halving, at which everything will work with a 99% probability
The risks that something could go wrong, as it turns out, are much greater! - Briefly point by point:
🔹 The Fed may rush and start cutting interest rates too early, repeating its mistake of the 1970s
🔹 Risk of recession in Europe ➡️ Germany is already de facto in recession by the end of 2023.
🔹 Risks from Japan ➡️ Collapse of the carry trade in the Japanese Yen
🔹 Risks from China ➡️reduction in GDP growth ➡️escalation of the conflict in the Middle East will worsen the situation.
🔹 Russia-Ukraine conflict ➡️If US assistance is reduced, Washington’s reputation as a strong and reliable ally will suffer ➡️ The likelihood of new conflicts around the world and the escalation of existing ones will increase
🔹 Taiwan factor ➡️ new president is “undesirable” for China
- In the event of an armed conflict between China and Taiwan, the potential damage could be estimated at -10% of global GDP (with Covid19 -6%)
🔹 Potentially possible return of Donald Trump to the presidency ➡️ Dramatic change in US policy
__________________________________
⚠️ The information provided is more than enough for you to think and form your own opinion. Remember that your successful trading should not depend on long-term forecasts. The projection of price movement between key reference points on the chart is approximate and should not be exactly repeated in the future, unless one understands this.
Think for yourself, decide for yourself - good luck in making independent trading decisions and profits ✊
Goodbye!


BTCUSDT.P POTENTIAL LONG/SHORT Opportunities BTCUSDT.P POTENTIAL LONG/SHORT Opportunities
Bitcoin is currently consolidating according to the weekly timeframe/external structure. However, when we look at the internal structure, we can clearly see swings where BTC recently formed a bullish SPA in the price range of 64,500-62,400. This resulted in a significant pullback in the market. However, we should not ignore the equal highs on the daily timeframe and the HTF OBs, which are also sources of compression. We should keep in mind the price level of 72,500-73,800, which could potentially give us a significant rejection.
SHORT OPPORTUNITY
ENTRY =73850
STOP LOSS =74960
1ST TARGET=66676
2ND TARGET =65419
3RDTARGET = 63430
LONG SIGNAL WILL BE SHARED LATTER

BTCUSDTWe can attempt to buy BTCUSDT from specified level as 0.5 FIB , HL , trendline support intact.
SL , TP mention in chart.
