BTCUSDC trade ideas

Chainlink vs BitcoinAs you can see BTC show signal of reversion after decelerate. Seems like we have stop on the roof, for the other side, Chain show all your potential with ~25% of growth. In my best bet, I think the Chain will growth until 0,00072 before start to drop until 0,00055

$4500 in 2/3 weeks BTC will end up under $4500 in 2/3 weeks and last for at least 14 weeks before any correction to rise again


BTC UpdateWe have two options :
1-bounce and retest the broken trend at 9800
2- death crossing between MA 20 & 50 which is clearly the sign to exit

Testing 10k!What you think of that? This is an important moment of BTC.I don't know if I have stomach for waiting until 10k. Look at RSI, showing for us that goes down first a little beat before goes up.


BTCUSDTechnically we are in the 4th wave based on the Elliot principal. probably EMA 21 in Weekly time frame with 0.618 Fibo retracement are important resistance levels.


Triangle pattern detected in BTCUSDC.looks like BTCUSDC will take new turn hoping a "long" on this chart...lets see until confirmation


USDC Mirror Chart! Bullish explosion coming soon!Good morning everyone,
Bullish:
- RSI over 50
- MACD rising
- Lines crossed EMA50 with a bullish first candle like before (drawn in the Chart), and stays above it .. last time it produced another bullish candle.
- We have a long time bearish trend line who broke some days ago.
Expect at least 50% within the next days.
Everything else drawn in the Chart.
I have a Premium Chat on Telegram. If you want to follow my trades PM me.
It would feel great if you support my work here.
Thanks for following.
Dont forget to hit like button (doesn't cost you anyhting).
And don't forget, this is not a trading advice. Trade at your own risk and make a plan before trading.

9090/9200 to 15kwhile looking at previous pattern i stumble on this lets see where it goes 4hr chart so far it matches almost perfectly from 18 march to may 18 will this play out till mid jun?

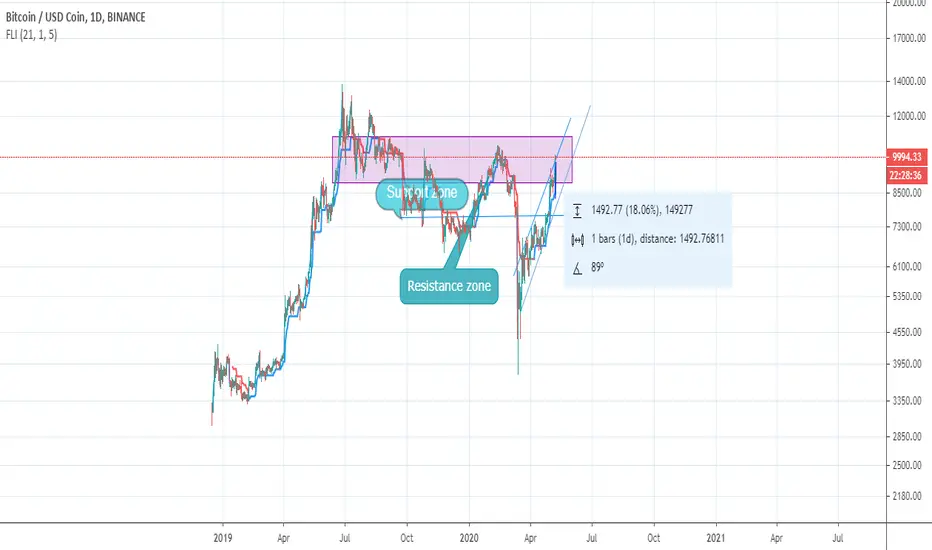
BTC shows its strength.Observing the bullish channel that formed since March, on the 13th, we can observe that on the 7th of May, when reaching the value of $ 10,000, the currency not only broke, with 90% strength in the RSI, as in the days that followed in its correction, 11 and 12, the price rose again without touching the baseline. It is also worth mentioning that by reaching the value of $ 10,000, the currency was able to exceed the average price of the resistance zone. This undoubtedly shows a lot of market willingness to buy the currency. And without a doubt, no matter how strong corrections there are in the medium term, in the long run the recommendation is to buy.

How far is it going?At times like this I ask myself a few questions. Why do people get so upset with me when they ask me for an investment recommendation and I talk about cryptocurrencies? Is 12 years still not enough?
But ok ok! Let's talk about what matters. Still crossing the resistance area, where the currency reached the zone average. I honestly can't wait for anything after $ 10,500 in addition to the correction. More precisely, it stopped being the point of purchase a long time ago, now even less. As for the peak of December 2017, which is unfortunately not available on the Binance chart, we will talk after the correction.
A brief update on BTC.I know, I know. I'm sorry, it's pretty confusing. I usually don't like to leave it like that either. So let's try to understand all of that. First, the averages indicate a correction of 6.84%, reaching $ 8,292. Be careful if you are thinking of entering now so as not to catch this falling knife. Soon after, everything indicates that we will have an increase of 25.39% raising the value to $ 10,439. What do you think?
//
If you like the script I'm using, comment below that I send.

Proving yourself52.2 thousand per day. Did we break or did we just hit the ceiling? I don't know about you, but I am optimistic. I see that the desire to protect assets is pushing gold and bitcoin. I don't expect a straight line, but the indicators are very favorable considering the consolidation zone of the previous fund. If the correction now reaches US$ 8555, we will have excellent expectations for the future (don't buy). So what do you see?
