BTC incoming new weekly camarilla levels and pivot pointIF the trend will continue this could be an area of opportunity. we will have to see how the coming week behaves.
BTCUSDT.3S trade ideas

Bitcoin Baptism "The Emergence Phase"An unprecedented bullish prophecy is poised to unfold on June 24th, aligning with Quebec's Saint-Jean-Baptiste Day. In a tale woven with both technical analysis and symbolic prophecy, traders whisper of an impending revolution that could reshape the market.
This date is predicted to mark the "decapitation" of the persistent downtrend that has weighed on the market since March 14, 2024, symbolizing a dramatic shift as the market emerges from the depths of bearish waters into a new era of bullish momentum. This transformative event is set to ignite an upward surge, propelling prices skyward and offering a baptism into a revitalized, bullish market landscape.
A critical fusion of positive delta volume with the total volume is set to align with maximum market activity, suggesting that buying pressure will dominate, creating a powerful synergy. As the buying pressure surges past key thresholds, the stage is set for an explosive upward movement. Bitcoin prices will be propelled towards the heavens if the upward trend in the lowest points of total delta continues, reinforcing the bullish outlook. Will the Halving remove his mask?
However, one key aspect that has caught the attention of savvy traders is the increasing bearish divergence between price and volume delta since October. While Bitcoin prices have shown resilience and a steady upward trend, the volume delta has indicated a disparity. This bearish divergence suggests that despite rising prices, underlying buying pressure is weakening, which could signal a potential reversal or at least a slowdown in the bullish trend.
Savvy traders, like vigilant knights of old, are preparing for the opportunity of a lifetime. They watch the omens closely, ready to capitalize on the prophetic market resurrection, where significant bullish opportunities await. By acknowledging the bearish divergence, traders can approach the market with a balanced perspective, remaining cautious but optimistic.
And so, as June 24th approaches, the community holds its breath. Will this Saint-Jean-Baptiste Day become legendary as the turning point in cryptocurrency history? Only time will tell, but the story of this potential market baptism is already capturing the imaginations of traders far and wide.
SystemBlundersX

BITCOIN VISION 25/05 After rising by more than 20% since the beginning of the month, BTC is retracing slightly on Thursday.
We are currently in a daily order block on equilibrium.
I'm still a buyer on Bitcoin, so we'll see how the price reacts to this order block.
✅ The target remains unchanged: ATH.
Feel free to give me your take on Bitcoin in the comments.
Do you see a new ATH by the end of the month? Are you buyers? Selling?
Feel free to subscribe and put a boost on this post if you enjoyed my analysis, and tell me what you think!
Happy trading and a great weekend :)

BTCUSDT - Bullish TradeThe price is in Bullish Trend depicting Bullish Flag Continuation Pattern.
The trade plan involves Instant Buying as Bullish Candlestick Patterns are already formed at LH.
No Bearish Divergence is formed.

BTCUSDT at hourly support, likely to bounce towards 71.2kThe price has hit the weekly resistance WR1 and has pulled back from there. The price has been pushed down from that resistance and it has now hit hourly support HS1 on this pullback. This support zone will provide support to the price and the price is likely to bounce enough for a long trade opportunity. We try this long trade towards weekly resistance around 71.2k area. If we lose this support then we are going likely for the daily support zone.

BTCUSD SELLBitcoin on more Selling pressure already we got 200 pips profit on last analysis...now more down side momentum captured let's take a short side with btcusd

🎉🎊 Congrats on the long! My next local scalps Trade 1: short
A reaction of previous supply for the beginning of the pullback to zone
Trade 2: long
A continuation play setup. We have broken out from the accumulation range at daily supply, this would be a secondary involvement at the pullback into demand. Note the pull back may not rally down to the POC, it could simply react off the old range high.
No change no trade
Follow for more

There are two falling possibilities for BTCThe first possibility is that it has made a double peak, there is a possibility of it falling down.
Then it will go up again, make the right shoulder, create the obo formation and hit the bottom harder.
If this scenario occurs, the bottoms will be crushed excessively
There is no certainty in crypto, this is a possibility

📊#BTC is worth paying attention to the short and long range👀🧠Structurally, a large double-top bearish structure holds true and we are in the midst of a weekly-level correction. It is currently in the rebound stage, and the goal of the double bottom structure has not yet been achieved, so we still have the possibility of rising, so don’t rush to go short, wait patiently for the price to reach the heaviest resistance zone (68888-71188) and look for a short structure above the hourly level. .
➡️If we are very strong and reach new highs, then a good callback will also be an opportunity for us to participate in the long position again.
🔖For opportunities to participate in spot trading, you can focus on the target area of the large double top bearish structure (39633-47700)📈
Don’t forget risk management💯
✔️Trade safe✔️
🤜If you like my analysis, please like 💖and share it💬
💕 Follow me so you don't miss out on any signals and analyze 💯

BTC/USDT 4HInterval Chart ReviewHello everyone, let's take a look at the 4H BTC to USDT chart as we can see that the price has bounced off the upper boundary of the downtrend channel, potentially giving room for a stronger downward move.
However, if BTC tries to exit the channel again, the price must overcome a very strong resistance zone from $71,959 to $73,853. However, after breaking above this resistance zone, an upward impulse to the area of $83,029 will be possible.
Now let's move on to the stop loss in case of further market declines:
SL1 = $68,378
SL2 = $66,144
SL3 = $62,363
SL4 = $60,014
AND
SL5 = $56,634
Looking at the RSI indicators and the STOCH indicator, you can see how both of these indicators rebounded from the upper limit, which resulted in a downward price movement, with room for the price to recover more. It is worth mentioning here that the RSI indicator has approached the upward trend line, which is worth watching because relying on it may again result in an upward movement.

BITCOIN - Price can break support level and decline to $64000Hi guys, this is my overview for BTCUSDT, feel free to check it and write your feedback in comments👊
Recently price entered to falling channel, where it broke $66500 level and fell to support line of channel.
BTC rose to resistance line, but at once made downward impulse, thereby exiting from channel and breaking $60200 level.
After this, price started to grow inside wedge, where it soon broke $60200 level again and rose to resistance line.
Then BTC made correction to support level, after which bounced and in a short time rose to $66500 level.
A not long time ago price broke this level and now it continues to trades near inside resistance area.
In my mind, Bitcoin can bounce down from resistance line to $64000, breaking support level.
If this post is useful to you, you can support me with like/boost and advice in comments❤️

Why Are Token Standards Needed?Token standards are crucial because they guide developers on creating and using tokens within a particular blockchain protocol, ensuring compatibility and interoperability among products developed using the same standard.
Token Standards
Token standards are essentially a set of agreed-upon rules that outline the design, development, behavior, and operation of cryptocurrency tokens on a specific blockchain protocol. For these standards to be effective, they must gain wide adoption. Without broad acceptance, these rules cannot be considered "standards" since standards are rules generally followed by a large community.
Why Are Token Standards Needed?
Compatibility: Token standards ensure that all products built using that standard can work together seamlessly.
Composability: In programming, a composable system allows developers to reuse existing components to create new products, which is also applicable to token creation.
Efficiency: Token standards enhance interoperability between smart contracts. When smart contracts follow token standards, they can manage all tokens on the network effectively.
Common Token Standards
ERC-20: The most popular token standard on Ethereum, allowing for the creation of fungible tokens. Examples include Shiba Inu, Tether, Uniswap, and ApeCoin.
BEP-20: A token standard on the Binance Smart Chain (BSC), sharing similar properties with ERC-20 due to their architectural similarities.
ERC-721: This standard allows for the creation of non-fungible tokens (NFTs) on Ethereum, used by many popular NFTs.
ERC-777: An improved fungible token standard over ERC-20, providing enhanced privacy and addressing certain issues with ERC-20 tokens.
ERC-1155: This standard helps reduce costs by allowing transactions to be grouped, and can be used for both fungible tokens like the Basic Attention Token and non-fungible tokens like CryptoPunks.
Wrapped Tokens
Tokens on different blockchains typically cannot interact with each other. Wrapped tokens address this issue by representing assets on one blockchain in a form that can be used on another. For example, Wrapped Bitcoin (WBTC) on the Ethereum blockchain is an ERC-20 token backed 1:1 by real Bitcoin. This allows WBTC holders to use Bitcoin within the Ethereum network for trading, farming, staking, and interacting with other ERC-20 tokens.
Token standards enable the use of diverse assets within the same blockchain, solving the problem of asset incompatibility and providing flexibility for the network.
Hope you enjoyed the content I created, You can support with your likes and comments this idea so more people can watch!
✅Disclaimer: Please be aware of the risks involved in trading. This idea was made for educational purposes only not for financial Investment Purposes.
---
• Look at my ideas about interesting altcoins in the related section down below ↓
• For more ideas please hit "Like" and "Follow"!

BTC Bitcoin Bullish Flag, Eyeing Potential Triple Top FormationIf you haven’t reentered Bitcoin in the buy area:
Bitcoin has recently shown signs of being inside a bullish flag chart pattern, a technical setup that traders often interpret as a continuation signal. This formation typically suggests a period of consolidation before a significant price movement in the direction of the prevailing trend, which, in Bitcoin's case, has been upward.
The flag portion of the pattern has Bitcoin trading in a relatively narrow range, indicating that the market is gathering strength for the next move.
While the bullish flag pattern suggests a continuation of the upward trend, traders should also be cautious of a possible triple top formation. A triple top is a bearish reversal pattern that occurs when the price reaches a similar high three times, with intervening declines. This pattern signals that the asset is struggling to break through a particular resistance level, indicating a potential shift in market sentiment from bullish to bearish.
In conclusion, Bitcoin's current technical setup presents a compelling case for a bullish continuation towards the $69,000 price target, driven by the bullish flag pattern.

BTC long idea @ 68.000CRYPTOCAP:BTC trade idea!
3-wave correction into resistance zone.
Limit entry at : $67,894.
Stop-loss: $66,000.
Profit target 1: $69,250.
Final target: $72,940.
BTC shoud resume the up move towards 74k area

BTCUSDTBTC soon to ATH again, range 75K..
keep eyeing for btc..
i'm also consider for btc etf inflow very very strong from instutision..
and US House passes FIT21 crypto billUS House passes FIT21 crypto bill..
to the moon

Chart Pattern Analysis Of Bitcoin
In this week or this month,
ETH And NVDA are the stars of the market.
I think the crypto market and AI stocks will still do better in the next season of the year.
But before the next bull run,
I am still cautious about the potential pull back of the month scale Wave(C) in the crypto market.
From K1 to K3,
It is a bearish three soldiers advancing pattern,
A short-term downtrend Or A large scale consolidation had started from K1.
The risk is increasing.
I will try to decrease my long positions if there are more bad signals from the following candles.

BTCUSDT:Currently, it is suffering because the dominance of Bitcoin is turning red, Bitcoin itself is turning green, so it is more logical to open a position in altcoins than Bitcoin itself.
Open a short position below 69076, open a long position above 71484

BTCUSDT.1DBTC/USDT daily chart, several key technical indicators and levels stand out, providing insights into potential price movements.
Trend and Resistance Analysis:
The chart shows that Bitcoin (BTC) has experienced significant volatility, with the current price hovering around 66,707.40 USD. The price is currently testing the resistance level marked as R1, around 67,373.58 USD. A successful break above this level could see the price testing the next resistance at R2, which is around 71,320.28 USD. The overall trend appears to have a slight upward trajectory as the price has managed to break above a significant downward trend line.
Support Levels:
There are several key support levels identified. The immediate support level is labeled as S1 at approximately 66,000 USD. Below this, the next significant support levels are S2 at around 59,357.32 USD and S3 at approximately 56,447.95 USD. These levels have historically provided strong buying interest, which could prevent further declines if the price retraces.
RSI and MACD Indicators:
The Relative Strength Index (RSI) is currently at 58.91, indicating that the asset is in a neutral to slightly bullish zone. The RSI has been trending upwards, which suggests increasing buying momentum. The Moving Average Convergence Divergence (MACD) indicator shows a bullish trend with the MACD line (blue) above the signal line (orange)
, supported by a positive histogram. This suggests that bullish momentum is currently stronger.
Volume Analysis:
The volume pattern indicates that the price increases are accompanied by substantial trading volume, reinforcing the bullish sentiment. The volume spikes at key price levels suggest strong market participation during upward movements.
Conclusion:
In conclusion, the BTC/USDT pair is showing signs of a potential bullish breakout if it manages to stay above the R1 resistance level. The indicators, including a rising RSI and a bullish MACD, support the likelihood of continued upward movement. However, traders should remain cautious of potential retracements to the support levels at S1, S2, and S3, which could offer buying opportunities. Monitoring the price action around these critical support and resistance levels will be crucial for making informed trading decisions.
Overall, the market sentiment appears cautiously optimistic, with key levels and indicators suggesting a potential continuation of the upward trend, provided the resistance levels are successfully breached and maintained.

Short term trade ideaRSI, EMA, and trend lines all point bullish on the 15 min time frame. The Trend line sitting at roughly 71,150 would be good entry on a short. Bitcoin should come back to 67k. Take profit on short around 67k. Not financial advice

BTCUSDT.P Short BTCUSDT.P Short
ICT Concepts
1. Change of Character
2. Liquidity Grab+ Tap into Order block
3. Entry at FVG

Bitcoin Fail in the ⚔️Third Attack⚔️ on the Resistance zone⚠️First, I must say that the Consumer Price Index(CPI) rates will be published today ( so be careful about your positions when they are published ).
🏃♂️ Bitcoin is currently moving in the 🔴 Resistance zone($63,440-$62,690) 🔴 (this is the third time it has attacked this zone).
🌊According to Elliott wave theory , Bitcoin seems to be in corrective waves . ( If the 🔴Resistance zone🔴 breaks, the scenario will change again) .
🔔I expect Bitcoin to start going down after the completion of main wave B to complete main wave C and at least fall to the Support line .
❗️⚠️Note⚠️❗️: if Bitcoin can break the 🔴 Resistance zone($63,440-$62,690) 🔴, the scenario will be changed.
❗️⚠️Note⚠️❗️: An important point you should always remember is capital management and lack of greed.
Bitcoin Analyze ( BTCUSDT ), 15-minute time frame ⏰.
Do not forget to put Stop loss for your positions (For every position you want to open).
Please follow your strategy; this is just my Idea, and I will gladly see your ideas in this post.
Please do not forget the ✅' like '✅ button 🙏😊 & Share it with your friends; thanks, and Trade safe.

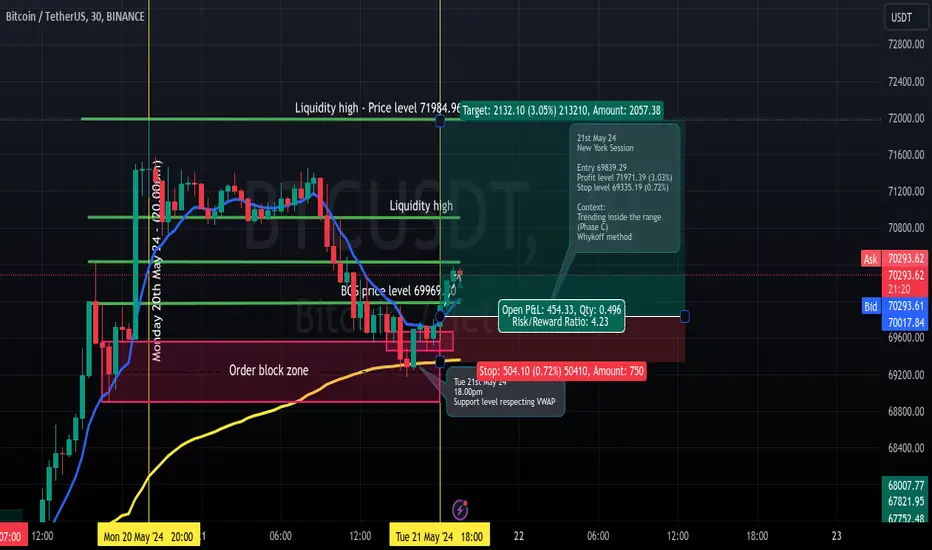
Long trade
21st May 24
Entry 69839.29
Profit level 71971.39 (3.03%)
Stop level 69335.19 (0.72%)
Context:
Trending inside the range
(Phase C)
Whykoff method
BTC balance day and all eyes on this 4hour Equilibrium pattern.Balance day !
Just a reminder . After bigger moves there nearly always comes a time for a fast flush.
All eyes are on this 4 h EQ. Break Bull and quick 12h HL is set, that would give ALTS some time to get Rotation.
Today ALTS seems are also mostly balancing today. D Inside bars or boring range trades:
Traders & Algos are waiting for this BTC range to break.
Noone knows exaclty when a fast flush comes, but you can prepare low bids across different names!
In case it happens you have orders ready. When it happens its usually too late to plan !
Create for yourself a Trading view Watchlist of the ALTS you would want to buy for D or 4h or 12 H HL´s -
and plan those trades and have limit orders waiting.
Liquidation runs a re great opportunities for professional traders !
