BTC Price Prediction and Elliott Wave AnalysisHello friends,
Thank you for joining me in my analysis. Remember to like, subscribe, and stay tuned for more updates. See you soon!
Thanks, Bros
BTCUSDT.P trade ideas

BTC shoulder head shoulderBTC maybe want to make his way to reversal shoulder head shoulder, that means we go to 60/62K. We might go up from there to new all time highs. What are your thoughts about it?

🅱️ Bitcoin Headed To $100,000!!! FOMO! Warning! Must Read!There is no need to panic, cancel any trades nor act fast; there is always time... Did we miss the bullish wave?
It is true that Bitcoin is now showing multiple very strong bullish signals and this is no cause for alarm; Bitcoin being bullish is always good for us and the Cryptocurrency market as a whole. We love Bitcoin/Crypto!
First, the chart:
➖ Bitcoin closed weekly full green and back above EMA10. This means that the bulls are in full control when it comes to the short-term potential. Where the action is headed next.
➖ Next, Bitcoin is trading above $60,000 which is ultra-bullish and this after months of a strong distribution/consolidation phase...
What will happen next?
What happens now?
👉 Yes Bitcoin is bullish and set to move to $100,000 and much, much higher in the long-term but, regardless of the short-term noise, we will see a crash in the coming days.
Bitcoin is likely to produce a lower high, not move higher and retrace to hit new lows before the major bullish wave. This fact doesn't change even though, Bitcoin is bullish!
Thanks a lot for your continued support.
Namaste.

BTC 15m LONGBitcoin uses peer-to-peer technology to operate with no central authority or banks; managing transactions and the issuing of bitcoins is carried out collectively by the network. Bitcoin is open-source; its design is public, nobody owns or controls Bitcoin and everyone can take part. Through many of its unique properties, Bitcoin allows exciting uses that could not be covered by any previous payment system.

BTC move to WAVE 4Everything is on chart
Btc can have little high and then go down to 44000$ in Wave 4
It's my opinion that can be mistake
My English not good

#BTC has a chance to form a bearish wolf wave📊#BTC has a chance to form a bearish wolf wave📉
🧠From a structural point of view, we are currently in the support zone, and the probability of rebound is higher than the probability of decline. Even if there are short expectations, it is not recommended to chase short here. It is reasonable to go short after rebounding to the resistance zone.
➡️From the perspective of wave theory, main wave 4 has been completed, and main wave 5 may be completed through micro pulse waves.
⚙️Because there is such an expectation, we will continue to be patient with the short orders we hold. If the development goes as expected, then we will make more profits.
Let's see 👀
⚠️Don’t forget risk management⚠️
✔️Trade Security✔️
🤜If you like my analysis, please like 💖 and share 💬
💕 Follow me so you don't miss out on any signals and analyze 💯
BINANCE:BTCUSDT.P

BITCOIN LONG SETUP ALL trading ideas have entry point + stop loss + take profit + Risk level.
hello Traders, here is the full analysis for this pair, let me know in the comment section below if you have any questions, the entry will be taken only if all rules of the strategies will be satisfied. I suggest you keep this pair on your watchlist and see if the rules of your strategy are satisfied. Please also refer to the Important Risk Notice linked below.
Disclaimer

BTC 4H Bearish channel or is it testing supports to shoot itselfBTC has drawn a bearish channel in the 4h time period with decreasing highs and decreasing lows.
We have 3 strong support levels where there are buy orders.
The latest SL would be at 56K, matching the long-term bullish trend.
On the other hand, we have strong resistance at 70555.
In the 1W timeframe, BTC would have to touch 78K - 80K. After reaching these levels, it makes more sense to go down to 56k than not now.
BTC usually reaches its goals with a bang and when you least expect it... curiously, when you think it's going to sh...t, that's when it rises like a rocket...
We'll see what happens this time.

🅱️ Final Warning: A 50% Capitulation Drop Will Lead To 30KThis is the final warning and a friendly reminder; what we are about to witness is a "capitulation drop!"
This event is not your common drop or "normal correction," instead, it is a major event that only happens once every several years and you have front row sits for it.
➖ If we calculate the average price for Bitcoin's trading range in the past month and a half, we get a number around $66,600.
➖ If we divide this number by two, the 50% capitulation drop, we get a number in the range of $33,300.
👉 Here is my idea of how Bitcoin will behave around this number if a capitulation drop does show up in the coming days or next month; May 2024 ... But first, let me tell you that May is normally a bad month for Cryptocurrency when the action is coming out of a multiple-years price high —that is BTCUSDT. This is the situation in which we are at today.
Bitcoin is trading at the highest prices ever and has been on distribution for quite a while now, this phase is about to reach soon two months.
This phase can last, it can last 3 months, 4 months and sometimes even a total of 6 months before the capitulation actually happens but do not worry, it won't extend this much this time around because the halving just took place.
Boost this trade idea and we will comeback for frequent updates.
So it is likely that this is it, the capitulation happens now, this or next month, and this is what we've been waiting for to start the new phase, the new wave, the new entry, the bull-market that will really heat up late, very late 2024 and all throughout 2025. All throughout 2025 it will be super, it will be big, it will be great; it will be the opportunity we have been waiting for.
What are you doing now?
Is not really about Bitcoin going to $100,000 before a correction or whatnot or predicting what happens next; It is really about buying when prices are low, waiting patiently and selling high at the top of the bullish wave.
➖ The time to buy was last year or after the flush takes place.
➖ The time to sell will be next year, after the bull-run is on its way.
Whatever the market does in the mid to short-term, there are always clear signals before a reversal takes place.
Look at the chart; volume continues to drop, the RSI becomes weaker every day. The loss of bullish momentum is the major indicator we have predicting a bearish wave.
The action should go something like this: The initial drop fast and strong; remember that the initial move is bearish marketwide, period. Then this move stabilizes and the ALTSBTC and smaller Altcoins will recover first. Mid-size second and the biggest one last.
Bitcoin is likely to recover 30-50% from the flash crash bottom low and then start a slow climb. Something like hitting ~30K in a flash and then moving to around ~45K to produce very strong volatility but to never look back, straight up but very slow growth for months and months... Imagine 6-8 months within a bullish consolidation phase. Rising but slowly until in Q1/Q2 2025 when everything really starts to speed up.
👉 So only one bottom and that's it... We will have to rush if we want to buy BTC.
The rest we will have plenty of time, it will be wild, it will be fast, it will be crazy, exciting... For many it will be profitable for others it will be bad as loses can add up for the unprepared and can even multiply.
Prepare now or plan, if not by doing numbers at least try and visualize... What would you do if you knew Bitcoin would hit ~30K before hitting a new All-Time High?
Share in the comments section below... In 2025, Bitcoin will hit a new All-Time High!
Namaste.

Bitcoin BTC price + CPI US 15.05 will stir up the marketHere is a chart of #BTCUSDT on the 12-hour timeframe.
At first glance, it looks nothing special: a prolonged consolidation on falling trading volumes, everything is natural and natural.
But tomorrow, at 15.05 at lunchtime with the close of the 12hr candlestick, everything can change.
Tomorrow is the announcement of the "fresh" US CPI rate.
Forecast: inflation will decrease from 3.5% to 3.4%.
Declining inflation = a good signal for the growth of financial markets.
But the tweet from Mr. Biden adds some "spice".
President Biden: wants to give new home buyers $400 per month for 2 years to help people with housing.
This is either a pre-election promise or a good opportunity to start the “printing press”
And now for a bit of conspiracy theorizing:
Let's assume for a moment that Biden knows a little more than we do. And tomorrow it will be announced that inflation has fallen not to 3.4% but to 3.2% or even 3%.
This will definitely cause a powerful surge and growth in the market.
The last thing that comes to mind is how massively $ were printed and distributed in the spring of 2020 as financial aid during COVID-19.
Do you remember how the crypto market grew then in 20\21 from an additional portion of “retail's crazy money”?)
So where do you think the CRYPTOCAP:BTC price will go in 24 hours?
👍 towards $71000
👎🏿 towards $56500

#BTCUSDT | 1 HOUR TIMEFRAME UPDATE#BTCUSDT | 1 HOUR TIMEFRAME UPDATE
We can look for confirmation to open a LONG position in the range of $66,500 - $66,230 ✔️
The target for this upward movement is $67,200 - $67,800 - $68,500 - $69,800 - $70,500 - $72,100 🔼
Invalidation below $65,010 ❌

The Relationship Between BTC Spot and BTC DerivativesThe Relationship Between BTC Spot and BTC Derivatives: Analyzing Market Dynamics
Bitcoin (BTC) has evolved from a fringe digital experiment to a mainstream financial asset, attracting investors from all corners of the globe. Understanding the intricate dynamics between BTC spot prices and BTC derivatives markets is crucial for market participants. This essay delves into the relationship between BTC spot and BTC derivatives, examining how the balance of shorts and longs in the derivatives market influences the spot price and why current market conditions indicate a bullish trend for BTC on daily, weekly, and monthly time frames.
BTC Spot and BTC Derivatives: An Overview
The BTC spot market involves the direct purchase and sale of Bitcoin for immediate delivery and payment. The spot price is a single variable representing the current market value of Bitcoin. In contrast, the BTC derivatives market comprises financial instruments such as futures, options, and swaps, whose value is derived from the underlying BTC asset. The derivatives market allows traders to speculate on the future price of Bitcoin without necessarily owning the asset.
The Interplay Between Shorts and Longs
In the derivatives market, traders can take long or short positions. A long position bets on the price of Bitcoin increasing, while a short position bets on the price decreasing. The balance between these positions provides insights into market sentiment and can influence the spot price.
Predominance of Shorts and a Bullish Spot Market
When the number of short positions significantly outweighs long positions, it indicates that many traders are betting on a price decline. However, this bearish sentiment can lead to a phenomenon known as a short squeeze. If the price starts to rise, short traders are forced to cover their positions by buying Bitcoin, driving the price up further. Thus, a predominance of shorts can paradoxically create a bullish environment for the BTC spot price.
Predominance of Longs and a Bearish Spot Market
Conversely, when long positions dominate, it suggests widespread bullish sentiment. However, if the price fails to rise as expected, long traders may start to exit their positions to cut losses, leading to selling pressure that can drive the price down. Therefore, a predominance of longs can result in a bearish spot market.
Current Market Dynamics: A Bullish Outlook
Examining the current market dynamics across daily, weekly, and monthly time frames reveals a bullish outlook for the BTC spot price. This outlook is driven primarily by the current balance of shorts and longs in the derivatives market.
Daily Time Frame: On a daily basis, the market shows a higher number of short positions compared to long positions. This imbalance suggests that many traders expect the price to fall. However, this also means that the market is ripe for a short squeeze. If the price begins to rise, short traders will rush to cover their positions, buying BTC and driving the spot price up. This potential for a short squeeze indicates a bullish trend in the short term.
Weekly Time Frame: On a weekly scale, the data similarly shows that shorts are predominant over longs. The continuous buildup of short positions creates a scenario where any upward price movement could trigger a significant number of short covers, leading to sustained buying pressure. As shorts scramble to exit their positions, the spot price could see substantial gains, reinforcing the bullish outlook for the medium term.
Monthly Time Frame: Long-term analysis also points to a bullish trend, driven by the sustained presence of a larger number of short positions relative to longs. Over the monthly timeframe, the market sentiment that has led to the buildup of shorts may eventually give way to upward price movements. The longer shorts remain predominant, the greater the potential for a significant price increase when these positions are eventually covered. This scenario supports a bullish perspective for BTC spot prices in the longer term.
Conclusion
The relationship between BTC spot and BTC derivatives markets is a critical aspect of understanding Bitcoin's price movements. The balance of shorts and longs in the derivatives market can significantly impact the spot price, with predominance in shorts often leading to bullish outcomes and predominance in longs potentially resulting in bearish trends. Current market conditions across daily, weekly, and monthly time frames indicate a bullish trend for BTC spot prices. The higher number of short positions relative to longs suggests that the market is primed for potential short squeezes, which could drive the spot price upward. As Bitcoin continues to mature as a financial asset, comprehending these market dynamics will remain essential for investors and traders aiming to navigate its volatility successfully.

Alikze »» BTC | Next move scenariosAccording to the analysis presented in the weekly time frame, Bitcoin registered a new ATH and is currently facing selling pressure in the lower time frame. Three movement scenarios can be considered for the next movements of Bitcoin.
🔰 The first scenario : if it is not able to break this ceiling in the weekly or daily time, it can continue its growth with a pullback to Fibo 0.78, the range of $50,000 and confirmation of the return to Fibo 1.618 and the next supply area.
🔰 The second scenario : with the failure of the current area, it will grow up to the Fibo 1.618 range of $75,000 and continue its growth with a pullback to the previous major ceiling until the supply area.
🔰 Third scenario : if it enters the correction phase and if it breaks the 0.78 fibo, this correction will continue and probably touch the 1.272 fibo of the previous wave.
»»»«««»»»«««»»»«««
Please support this idea with a LIKE and COMMENT if you find it useful and Click "Follow" on our profile if you'd like these trade ideas delivered straight to your email in the future.
Thanks for your continued support.
Sincerely.❤️

BTC LONG I will open long signal, if BTC show any sign of strong rejection from this area
Take profits from everyone MIL:1K move, SL -1k from current price.

BTC/USDT 1DAY UPDATE BY CRYPTOSANDERS !!Hello friends, welcome to this BITCOIN update from Crypto Sanders.
Hello dear traders, we are new so we ask you to support our ideas with your LIKE and COMMENT, also be free to ask any question in the comments, and we will try to answer all, thank you, guys.
Bitcoin has broken down the ascending trendline and is trading within the Ichimoku cloud zone. Expect downward movement and consolidation inside the ascending triangle. A breakout above the horizontal resistance could lead to significant gains.
Stay tuned for further updates and analysis. Thank you!
Remember:-This is not a piece of financial advice. Stay tuned to us for further updates and analysis. Thank you!

BTC's next move...Around June 24th, we will pump #BTC.
I know some are saying June 22nd is a Gann number, but it's not going to work this time, just like it didn't work some times in the past.
We will close June bullish!
The bull run will end in May 2025.

#BTC reaches the staged rebound target area📊#BTC reaches the staged rebound target area✔️
🧠The market has rebounded as expected and has now reached the phased rebound target area. We need to be alert to the risk of a pullback. Yesterday we said that the bullish cup-and-handle structure has failed, so there is no reason to continue to be bullish. Even if there is a strong rebound, I will not be too optimistic.
➡️From the perspective of wave theory, there is the possibility of a bearish wolf wave forming here. Wave 4 may be completed here, beware of the occurrence of wave 5. ⚠️
Let's see 👀
⚠️Don’t forget risk management⚠️
✔️Trade Security✔️
🤜If you like my analysis, please like 💖 and share 💬
💕 Follow me so you don't miss out on any signals and analyze 💯
BINANCE:BTCUSDT.P

BITCOINHi guys
If the support range of $65,800 is consumed, the possibility of completing the double top pattern and a downward trend will be strengthened.
It is likely that the announced data will be the driver of this downward trend if it is announced more than expected.
Considering the maintenance of the resistance range, the possibility of continuing the upward trend is weak, and it should be seen how Bitcoin reacts to the specified support range.
What do you think?

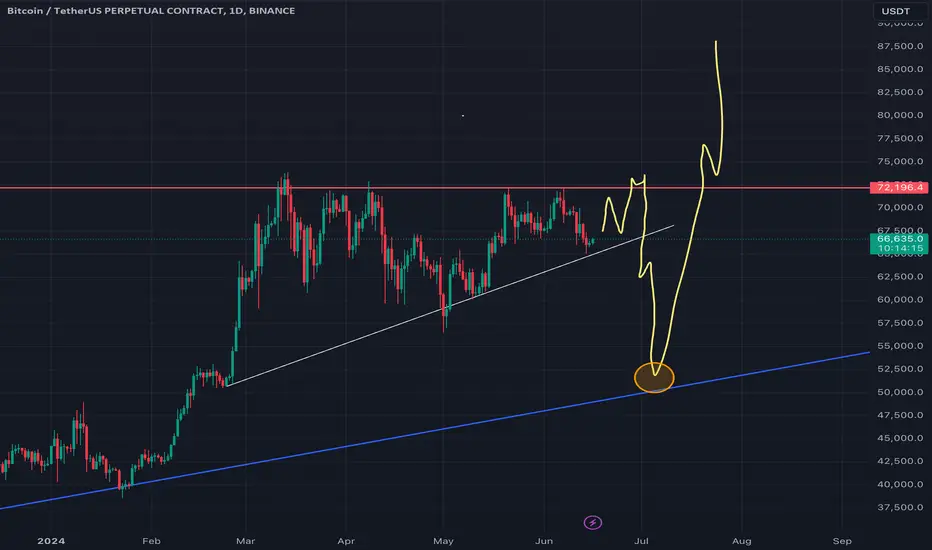
Potential BTC Deep CrabIf the 65k region on btc holds today, btc should continue on to 84-85k region
If 65k region breaks, 52k region likely

Big Short on BTCwe will see the 62000 then 52000 in btc chart and it will be happen in these 10 -15 days that will make some changes

Get ready for a move soon! My next trade Today's video talks about the notion behind fair value gaps, the importance on managing your risk even while in a trade and potential shlong(short and long) setups for bitcoin.
Follow for more market updates

BTC plan for the upcoming monthsMax pain is coming for BTC traders IMO, equla highs untaped, many started to be bearish early, the ideal scenario based on people emotions to taped the qual highs and liqudate the early shorts and make people bullish again at the highs then smash the price to 50K make people think the bull market is over, liquidate the shorts again and starting the bull market
BTC 1d - ICTalthough price reached the weekly fvg we didn't get a reaction. there is a possibility that we will reach the daily fvg we have below before we start displacing higher.
im waiting to see the 4h price action
