BTC/USDTShort-mid term BTC can go to 79k - 80k+, after that,a correction of 55 - 70% may come.And next year the Bull Market TOP can be around 120k.
BTCUSDT.P trade ideas

Btc new athHi everyone, wish u all a great weekend
New ath for btc/usdt will be happening till 5th jun
Then we will go for a big dump
Hope u get noticed
Wish u the bests

btc channel i think this is btc channel and just(( at up we have liquidity can collect this and reduce so be care))

Bitcoin sellBTCUSD big selling pressure on its way fasten your TPs and SL most of the chance suddenly market fall into our TP ... so be careful with your positions... take rest it's already 60 pips profit given ... hopefully more 200 pips expected to fall

BTC CUP AND HANDLE CHART PATTERN SPOTTED Following the recent Bitcoin 2% dip as Mt. Gox wallets move over $7 billion crypto exchange Mt. Gox moved over 107,000 BTC worth nearly $7.3 billion to a single unknown wallet ahead of its plan to return BTC to creditors before October.
This has caused a massive FUD as price dips down to FWB:67K
A CUP AND HANDLE CHART PATTERN has been formed in the WKLY TF indicating a potential bullish trend while the temporary dip, builds up liquidity for the the next bull run 🚀

bitcoin update analysisPlease also check the previous analysis. Undoubtedly, these analyzes were among the best analyzes in the world today, maybe even the best


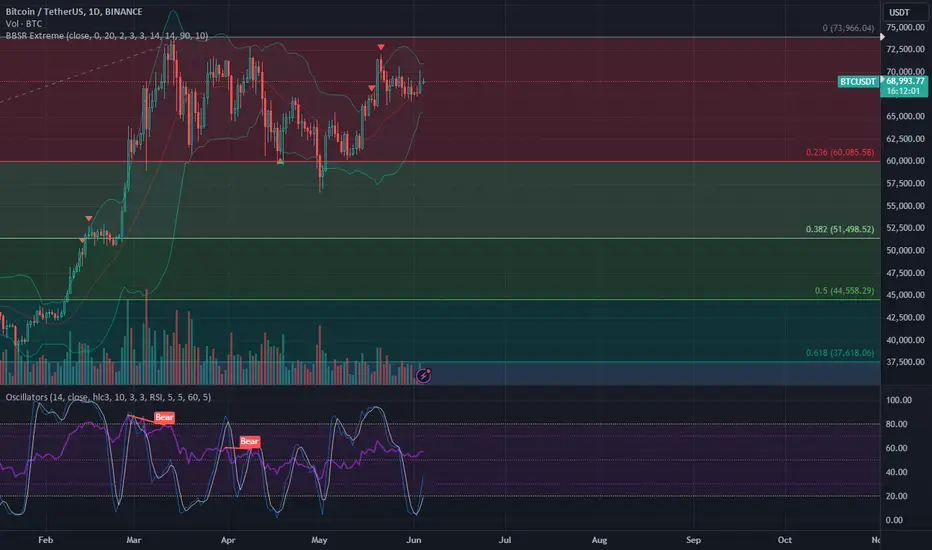
BTCUSDT.1DThe daily chart for Bitcoin (BTC) against USDT showcases key technical aspects that provide insights into potential future movements:
Resistance Levels:
R1 ($65,799.19): This level has previously acted as a strong resistance where price failed to break higher, suggesting significant selling pressure at this point.
R2 ($75,719.00) and R3 ($79,914.46): These levels represent further psychological barriers and possible profit-taking points if the price were to rally.
Support Levels:
S1 ($59,244.67): This is the nearest support level, currently underpinning the price. A breakdown below this could lead to further declines.
S2 (not explicitly marked with a price but indicated on the chart), and S3 and S4: Lower supports which, if breached, could signify a bearish market sentiment.
Current Market Position:
The price of BTC is currently at approximately $68,972.39, hovering just below R1 and above S1. This positioning indicates a consolidation phase within these boundaries.
Technical Indicators:
MACD (Moving Average Convergence Divergence): The MACD line is below the signal line but close, indicating a potential for a bullish crossover which could signal upward momentum if it occurs.
RSI (Relative Strength Index): The RSI is at 56, suggesting that there is room for price growth before reaching the overbought territory (typically above 70).
Trend Analysis:
The presence of an upward trendline from previous lows provides a visual representation of the current uptrend. This trendline acts as a dynamic support that can guide the price higher.
The current price is testing this trendline, and a sustained break could determine the short to medium-term market direction.
Trading Strategy:
Bullish Scenario: If BTC breaks and holds above R1, it would indicate potential for a move towards R2 and R3. Traders might look to enter long positions on a breakout above R1 with stop-losses placed just below this level.
Bearish Scenario: A drop below S1 could trigger a move towards lower support levels. Short positions could be considered if there is significant volume supporting the downward move, with stop losses just above S1.
Conclusion: Monitoring the reaction of BTC at these critical levels (R1 and S1) and the behavior around the trendline will be key. A decisive move either above R1 or below S1, supported by strong trading volume, would help confirm the market's direction. As always, it is crucial for traders to consider external factors such as market news and global economic conditions that could impact cryptocurrency markets.

Polyx going shortBased on what i see from the bb, the lower bb is going up, and I believe it will drop to either 0.38 or 0.33. After that, i will start to bullish. However, it is still depend on BTC.
DYOR
BTCUSDT LONG Day chart view shows uptrend continues low time frame also looking upside breakout completed ...
1:2 RR use proper MM

Chart Pattern Analysis Of Bitcoin
K3 break up and close upon K2 under low supply pressure,
It seems that the following candles will price up to test the resistance.
I don’t think this is the start of another bull run,
It is just a Wave(B) of a larger scale consolidation process.
But during this process,
Some other crypto tokens will do better.

BTC - 4H pennant Btc has 3 days of squeezing left within this pennant formation on the 4H. Most likely depending on the macro market outlook on Monday we will see a breakout the the upside which would lead us back to the key $71.3k level or back to the FWB:65K level if we breakdown.
Very important pattern to watch for short term price action. Will keep you updated.

Bitcoin on the way to 75,000 thousandHello, welcome. In the 4-hour time frame, Bitcoin has formed a repeating triangle pattern, and it can break upwards with strength, it can go up to 75 thousand dollars.
be profitable

BTC giving long opportunity !BTC is dumping so now what.
●Btc has weekly FVG/BISI /FVG High at $66k and FVG low at 65k.
●Expecting BTC to touch these levels but should not give weekly candle below this FVG.
●I'll be looking to long from the Weekly FVG.

Elon Musk Massive Influence Over CryptoThis is to highlight the impact of the tweet by Elon Musk on May 12th detailing that Tesla would no longer be accepting BTC as a form of payment for vehicles.
x.com
By May 17, Elon aslo confirms that Tesla has not sold any BTC
x.com
Despite massive crash, that led to a near 50% dip in a week.
If Elon Musk comes back strong into crypto, expect serious volatility.

warning btcwarning btc
this is very important location chart
i think thic place chart is very best chance for sell

BTC eyeing $110,000 Confirming the Major Flag Pattern Since FebrSince February, a significant flag pattern has developed in Bitcoin's trading behavior, and we've just witnessed its confirmation. This pattern indicates strong continuation potential, suggesting that the price could surge higher. It's not too late to enter the market; there's still an opportunity to capitalize on this movement.
In shorter term: as Bitcoin approaches its all-time high, and it has begun a nice correction.
Ideally, it would maintain minimal correction above $68,000 and increasingly form some type of contracting pattern. Regardless of the specific shape of the contraction, the longer it lasts, the better, even up to 1-2 weeks.
After that, the next target price is $110,000!!! If you don't want to miss out, you can start buying during the contraction with a very tight stop loss at the bottom of the sideways movement. However, be prepared for potential sharp drops.
Timing is also crucial; it could reach this within a month. It's a long time to stay in a trade for a month, but in this case, I think it's worth it...

BORING BITCOINHere is some shocking analysis - Bitcoin is sideways and there is nothing to do for now! Immediate target if you are in a trade is still the area around the all time high - the top of the range.
03/06/24 Weekly outlookLast weeks high: $70,741.40
Last weeks low: $68.714.79
Midpoint: $66,688.18
As we enter the Midway point in the calendar year BTC finds itself continuing to battle its '21 ATH. For many weeks now we've seen this key S/R level flipping from support to resistance and vice versa, will we finally see a breakout move above this week?
Although for the last few weeks the general attention has been focused on the ETH ETF, now that that is over and had a bullish turnout the market is looking for BTC to lead the way. Price is now above the 4H 200EMA, Post-halving supply shock effecting tokenomics positively in terms of supply and demand and currently breaking down the previous cycles high. Given all that in mind I think the patient will be rewarded as I think when BTC does get a clear run, most likely when Greyscale stop selling at a rate that causes outflows to overcome inflows. Top buyers sell pressure is relieved as holders who were underwater all bear market sell their positions and give way to buyers with high conviction. Then we will see BTC target $80K, only a matter of time.
This week I am focusing on BTC strength and signs of a breakout, I would say that once BTC breaks out, ETH will break above $4K and target ATH @ $4.8K. Things to look out for is any US news that could effect the markets; law making, Veto's etc.
Hopefully you had a good first half of 2024 and good luck for the second half!!

78980 next tp BTC now prepared for new ATH which will be around 78980 plus minus , this may be the last rally of 1st bullish rally , still time to decide , if this is last rally which confirmed triggered recession pullback of all world financial intrument to ground , floor inclu nasdaq gold

BTC and Social MediaHello everyone, i will try to make this as simple as possible, so i will not take allot of your time, but still trying to prove my point.
The best way in my opinion, in order to find out what is going to happen with BTC in 2024, is to ask the correct question. So i will ask the following, and answer with my personal opinion.
Question: What is BTC in 2024 and it was in also 2018? Answer: A strange popular concept of virtual money, that makes people both curious and sceptics.
The popularity among crypto currencies have increased allot since 2009, so we can say that today, crypto currencies are spread thru 90% of users of social media.( I don't have a statistic about this, i am just assuming this, since all the users of mobile phones are going to see some type of topic related to crypto or any type of investments.)
In my personal opinion, popularity is what makes BTC and other crypto currencies to raise or fall. Its very simple, people are getting excited, they will buy at any price so the value will increase, or, people will get scared, and will sell at any price.
I have posted to pictures. The one above, is the coin marketcap since 2014.The picture under, is the registered users on social media platforms, Facebook, Myspace, Friendster. without some other very important, like TikTok, YouTube or Tweeter. But, i think the rise will apply to all others platforms similarly.
If you look at crypto market cap picture, and then at the registered users in 2018 and 202 you will see one of the most interesting things, that i am sure many of you have missed. Just take a second, and see if you can tell. ( Side question - does anyone knows if tradingview has a cryptomarketcap chart? )
My point is simple
2017 - 750 bil market cap and 1,731 bil users
2022 - 2,86 trl market cap and 4,632 bil users x 3 times increase than 2017
2024 - 2,72 trl market cap and 5,037 bil users NOT SO MUCH INCREASE
( another side question for Tradingview, can you share a similar graph with registered users since 2014?)
I am associating Social Media users with potential customers for brokers, exchanges, trading platforms, investment banks, etc. Because this is how companies are targeting new customers in 2024, inclusive potential investors.
In conclusion, even though we are 2 years from last bullish wave, there is a potential for crypto market to rise but not much. I can not say a fixed price, but i think now, in 2024, BTC hitting 100k is very optimistic, unless Biden start printing again USD.
Another way for BTC and crypto to increase 40% this year, so BTC 100k and coinmarketcap 4trl, is that investors to move money from other assets to crypto, which is not so probable, since all the investors are having a vast portfolio.
So yes, it is possible for BTC to hit 100k this year, but not probable, in my personal opinion, because there is not enough money willingly available, to be moved to crypto.
Good luck guys!

Bitcoin and altcoins overview(May 29-30)Yesterday, Bitcoin was traded between the volume support zone and a large cluster volume of the seller, which we marked with a yellow line.
Locally, the forces of the buyer and seller are equal, the buyer is still unable to secure a position above, but the priority remains with the purchases.
The selling zone in the implementation of this scenario remains the same: $71,000-$71,400 (volume anomalies).
Otherwise, there is a probability of breaking the inclined line and falling to the level of $66,300, with a possible dip of this mark.
Buyer's zones below: $64,500-$62,700 (pushing volumes), $61,200-$60,400 (volume zone) $58,500-$57,000 (volume anomalies).
Interesting altcoins.
Bitcoin dominance is starting to decline, this is one of the signs of altseason. Individual coins are already starting to grow strongly: AUCTION, NOT, TRU, KEY.
It is worth looking at coins that are now being traded.
For example, ENA , a strong coin of the Ethereum ecosystem, which is currently in a local bullish trend, and in the zone of maximum volume.
For intraday trading, you can consider UNFI and try to open a hedge deal in short from the volume zone $5.05-$5.11.

BTCUSD - Legendary Bitcoin Core!Areas of interest is $69,000 - $63,300
The range is wide as choppy price action do not provide high accuracy on a macro level
