BTCUSDT trade ideas

BTC/USDTdivide the volume of the allocated deposit into three parts
Limit buy zone
0.618 - 30 %
0.786 - 30 %
1 - 30 %
-------------------------------------------------
Take profit zone
0 - 30 %
-0.18 , -0.27 - 30 %
-0.618 - 30 %

BTC Market Update 6th JuneMarket Update 📊: Bullish Crypto and Extremely Bullish ETH
Ethereum (ETH) is projected to reach $6,000 by the end of the year or possibly sooner.
ETH ETF Trade:
- ETFs have the potential to accumulate over 1 million ETH.
- Currently, 3.3% of ETH’s circulating supply is held in investment vehicles globally.
Trend Analysis:
- ETH investment vehicle flows have been declining steadily since November 2021.
- This decline mirrored Bitcoin (BTC) flows until the U.S. spot ETF hype began.
- Investment flows have remained stagnant for the past 2.5 years.
- A significant trend shift is anticipated following the launch of U.S. spot ETH ETFs.
Forecast for U.S. Spot ETFs:
- Expected Net Inflows: $4 billion in the first five months.
- Basis of Estimate:
- Relative global ETH AUM market share compared to BTC: 28%.
- Comparison between CME’s ETH Open Interest (OI) and BTC: ETH currently at 23%.
- Benchmarking against cumulative spot BTC ETF inflows of $13.8 billion.
Projected Inflows:
- Estimated Net ETH Inflows: $3.1 billion to $4.8 billion.
- Equivalent to: 750,000 to 1,000,000 ETH.
- Represents: 0.65-0.85% of ETH’s circulating supply.
Market Dynamics and Outlook
Estimated inflows of $4 billion to ETH and approximately $3 billion of sell-side pressure in BTC (due to Mt. Gox releases) favor ETH/BTC strength over the summer. While ETH/BTC has been on a linear downtrend for the past two years, the imminent positive catalyst for ETH and corresponding negative catalyst for BTC suggest a potential breakout.
Periods of ETH outperformance tend to be short-lived but very strong. In 2021, ETH's significant outperformance against BTC occurred in a seven-week period from late March to mid-May. Given the current setup, ETH is positioned for summer strength. With the ETH/BTC ratio at 0.054, taking a long position on ETH versus BTC is considered advantageous.

Short Setup to take out Range lows?Looking forward to entering a short here (blue box) which would bring us down to at least the second blue box and therefore take out the range lows liquidity (fat white lines)

BTCUSDT-4Hover 300 milion dollar in long position liquidated in 24hours ago beacuse the market was crashed,my idea is the bearish trend is going to countinue for grab more liquidity to form new ATH in midterm.(to the moon..)

Btc trading rangeI think btc is in a trading range and at least for now it wont continue its upward move, dont forget money management

Watching breakout here on #BTC missed my entry at 65k never wicked over weekend, being patient now for the breakout, see if we get the entry & it runs for the new range highs

BTC PriceTrading in the upward trajectory, Bitcoin price structure favours the further potential up move toward the $75K.

BTC:SELL Don’t get emotional BTC has been around, for most of us we have cheered it on as it broke all the predictions. It was a once in a lifetime opportunity for the believers. It rewarded newcomers for years for their faith.
It is a beautiful technology and will always be a classic store of value within the Crypto community it grandfathered.
Despite this: Times are changing. Do not get overly emotional. Currently it is priced over $70k.
The area is a notorious resistance. Be smart and use this range to set up shorts. Make money, trade the chart. Volume and a need for liquidity tell us: SELL
Someday we will see those wild predictions come true. But for now, wait to buy back in at lower prices.

Knife Painting by Bit CoinBTCUSDT.P @ 1D | LANE HOPPING
Knife INCOMING! Place your palms firmly and catch with care. *Band aids not included.*
Metaphors aside, candle structures can be quite deceiving, therefore playing “Time Frame Detective” is vital as that’s where one may discover the revealed “Knife Painting”.
It’s not the question of IF, but precisely WHEN.
Bitcoin has been weaving quite a flag since Q1 and into Q2, with lots of noise... and still weaving.
Sub-Support: $47.8K to $54.5K
Support: $44.4K to $50.5K
To all my fellow ‘Ninja Scalpers’, this may be another opportunity where hedging skills may improve significantly. Anticipate, do not improvise.
The story obviously doesn’t end here. This move may be fun, resulting in a V-Shape recovery to NEW DISCOVERY:
FWB:88K to $96K window
Stay vigilant Ladies and Gents.
Sleep.Hunt.TP. You know the drill.

BTC Price Prediction and Elliott Wave AnalysisHello friends,
Thank you for joining me in my analysis. Remember to like, subscribe, and stay tuned for more updates. See you soon!
Thanks, Bros

BTC Price Prediction and Elliott Wave AnalysisHello friends,
Thank you for joining me in my analysis. Remember to like, subscribe, and stay tuned for more updates. See you soon!
Thanks, Bros

BTC SIGNALS ALTCOIN SEASONWhen there is a new high on the chart for BTC, I believe ALTCOINS will severely out perform BTC

One of the strongest moving possibilities of BitcoinThis is not investment advice.
It only shows the strongest possible movement of Bitcoin for the higher time frame

BTCUSDT :I should analyze the American time, but I'm not at that time
Bitcoin has a range, that range of liquidation of people is high, which means that it may pump that area and we will have an upward trend.
You can give us up to 74,000 bitcoins
72190 is an important resistance for me. Go to the exchange book and look, wherever there is more book, put a stop buy there.
In three days, the weekly will be closed, either it has to be closed or it has to be rejected, if it is closed, we will go for 85 thousand.
The ascending wave that has started is much smaller than the previous ascending wave
Today, opening a short position is very risky, open a long position above 69639, that is, after 71644, it is a very good point to open a long position.
Early position is not necessary for Bitcoin, 71644 is good
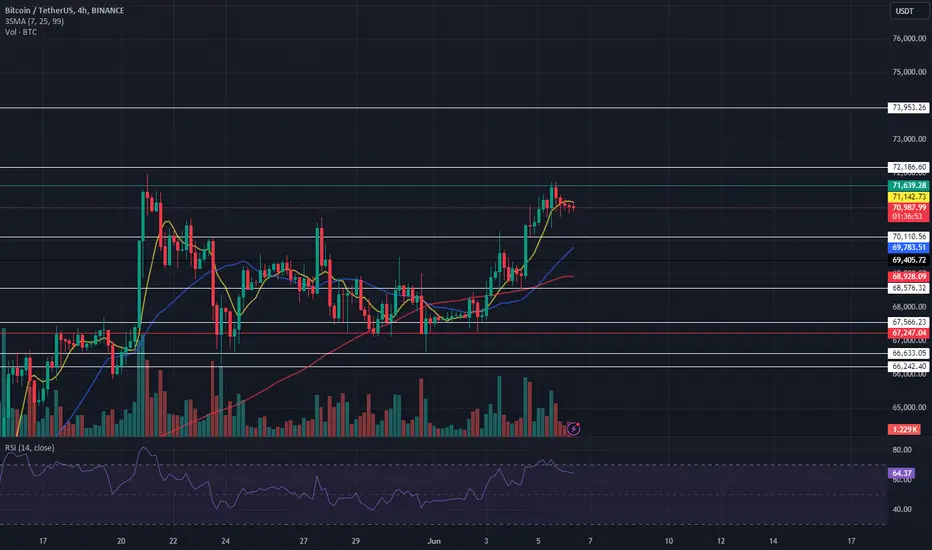
Bitcoin and altcoins overview(June 6-7)Yesterday we tried to consolidate above the volume zone in bitcoin , but so far unsuccessfully.
We are still trading within this zone.
Local expectations are the same, with a higher probability we will go for a small correction.
Globally, longs should be considered from the nearest buyer zones with the aim of renewing ATH.
Buyer zones: $70,000-$69,000 (pushing volumes), $68,200-$67,200 (accumulated volume), $64,500-$62,700 (pushing volumes), $61,200-$60,400 (volume zone) $58,500-$57,000 (volume anomalies).
Interesting altcoins.
For the TIA coin, it is worth considering a long, at least to the upper border of the local sideways, when forming this structure (consolidation above ~$10.6).
When the lower border is hammered, a strong buyback appears, as well as quite large volumes are formed, for the positioning of which it is interesting to observe.

December 2022 = major short squeeze???Boring times in the crypto market so great opportunity to analyze deeper than usual. What I have found is that when BTCLONG crossed above RSI 50 level (monthly close March 2021), a long squeeze followed and it is still going on since April 2021. With monthly closure of November 2022 BTCSHORT will close above RSI 50 so I wonder whether there would follow a major short squeeze like, long squeeze in April 2021. I draw a Fib retracement and maximum pain for both sides show us a price level of around $ 31000. Maybe a Santa rally till this level is coming? What do you think?

BTC 1 H /06.06.20204The market frequently created a structure like this when there is POI above. The price must tap an extreme POI before starts dropping.

BTC UPDATE#BTC did attempt to breakout and again closed before turning it into a fakeout. We have a support at $70,500 which price rejected and looks like it’s going for a retest now. A new HH is expected very soon, by the end as structure is bullish.

Where are you going dear crypto? (long term)Bitcoin finished 5 weekly wave in end of 2021 and we are in more complex forth monthly wave. So where we are?
TOTAL3 also finished 5th wave and alt coins are in corrective move (ABC) - look at elliott wave oscillator and squeeze indicator
BTC.D looks like accumulation structure. Note: I am not sure if we saw spring yet.
ratio TOTAL3/BTC looks like triple top (ratio 1 looks like strong resistence) and rising wedge with decreasing volume.

The road to Bitcoins all time high! My next tradeIn this video we go through the recent price action for Bitcoin.
Our levels remain similar to yesterday with the addition of 3 local scalps namely 2 continuation plays and one potential PO3 play
Follow for more

Bitcoin (BTC) Market UpdateCurrent Situation:
Yesterday, Bitcoin saw a 4% move to the upside, igniting the rest of the market. If this trend continues, we could be in for a very strong month.
Resistance Levels:
Major Resistance: $72,000 (bottom of the range area acting as major resistance)
All-Time High: $73,800
Next Resistance: $76,000
Market Dynamics:
Short Squeeze Potential: Many short BTC traders have their stop-losses just above $72,000 and even more above the all-time high of $73,800. If the price starts triggering those stops, it could cause a cascade effect, pushing the price higher as short traders cover their positions by going long.
Bullish Breakout: A move above the all-time high of $73,800 will likely trigger significant bullish momentum, potentially driving the price to $76,000 or higher if a massive short squeeze occurs.
Impact on Altcoins:
Bullish Sentiment: A breakout above the all-time high will be very bullish for the broader market, especially for altcoins, which have been lagging in recent months.
Trade Strategy:
For Bulls: Watch for a breakout above $72,000 and $73,800 for potential long opportunities, targeting $76,000 and higher.
For Bears: Be cautious of potential short squeezes and set stop-losses appropriately above key resistance levels.
Stay vigilant for market movements and ready to capitalize on potential bullish trends.
#Crypto #Bitcoin #BTC #MarketUpdate #ResistanceLevels #ShortSqueeze #BullishTrend #Cryptocurrency #Trading #Blockchain

Bitcoin (BTC) is currently in Phase D based on WyckoffBitcoin has further upside potential. If the price breaks through the resistance level at 72,000, the next price target could be the high around 84,000.
Key Points:
Phase D (Accumulation): Bitcoin is being accumulated by large players (institutions) after a period of price decline. This is characterized by increasing trading volume and the formation of strong support levels.
SOS (Sign of Strength): A significant price increase in early April indicates strong buying interest and is an early signal of a potential trend reversal.
Last Point of Support (LPS): The formation of a support level around 60,000 shows that buyers are strong enough to prevent further price decline.
Backup (BU): A brief price decrease after the SOS to test the support level and trap sellers.
Resistance Lines: Horizontal lines at 68,000 and 72,000 indicate resistance levels that need to be broken for the uptrend to continue.
Support Lines: Horizontal lines at 60,000 and 56,000 indicate support levels that can prevent further price decline.
