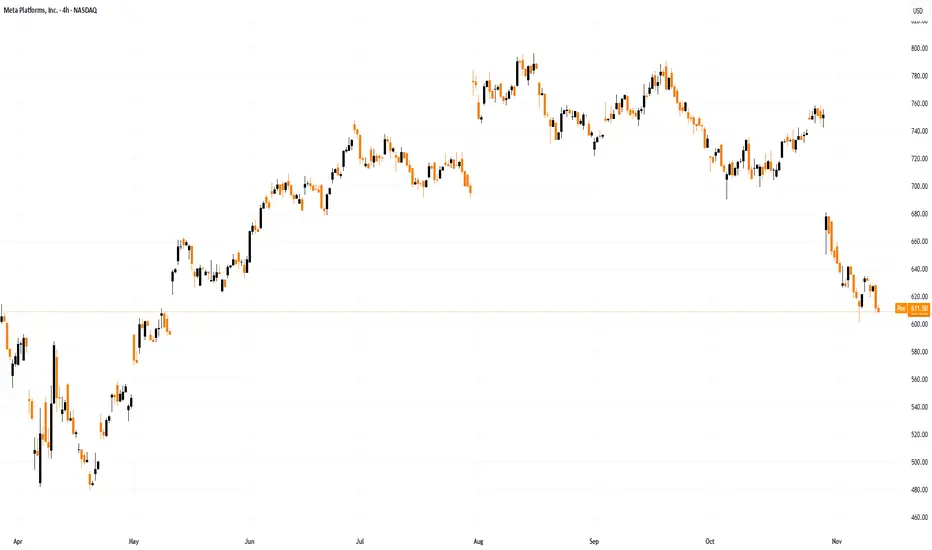
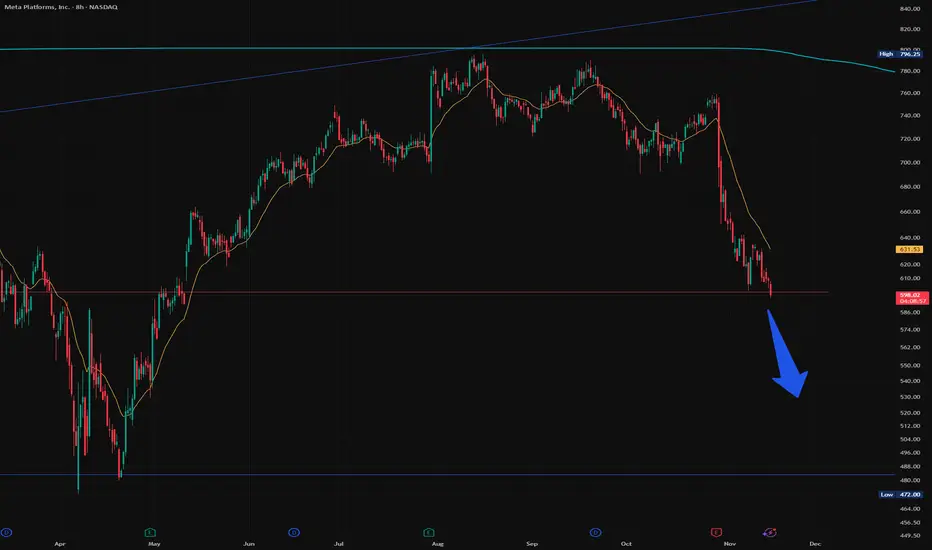
META entering Bear Cycle territory.Meta Platforms (META) has been on a steady decline since its August All Time High (ATH) that is lately accelerating. The reason the breaking below its 1W MA50 (blue trend-line) last week for the first time since April 2025. That was the time that the market formed the bottom of the Tariff War Crisis
Key facts today
Next report date
—
Report period
—
EPS estimate
—
Revenue estimate
—
90,920 COP
274.71 T COP
724.67 T COP
2.17 B
About Meta Platforms, Inc.
Sector
Industry
CEO
Mark Elliot Zuckerberg
Website
Headquarters
Menlo Park
Founded
2004
ISIN
US30303M1027
FIGI
BBG01PP4SDG1
Meta Platforms, Inc. engages in the development of social media applications. It builds technology that helps people connect and share, find communities, and grow businesses. It operates through the Family of Apps (FoA) and Reality Labs (RL) segments. The FoA segment consists of Facebook, Instagram, Messenger, WhatsApp, and other services. The RL segment includes augmented, mixed and virtual reality related consumer hardware, software, and content. The company was founded by Mark Elliot Zuckerberg, Dustin Moskovitz, Chris R. Hughes, Andrew McCollum, and Eduardo P. Saverin on February 4, 2004, and is headquartered in Menlo Park, CA.
Related stocks

$META selling off pre-market after news of the AI lead’s exitNASDAQ:META is selling off in pre-market after news of the AI lead’s exit, according to Bloomberg.
If Meta were still in a strong bull trend, this kind of headline wouldn’t have mattered .
I remain short and will look to cover or reverse near (2) if the setup plays out.
📉 Technicals favor contin

Death Cross - Contrarian BuyRarely does the death cross actually provide a meaningful sell signal given its lagging components and, in some cases, can end up being a better buy signal. I think this is one of those times where META death cross is providing another meaningful buy signal as the price is well below the 200-day mov

Meta Platforms (META) Shares Fall to Key SupportMeta Platforms (META) Shares Fall to Key Support
In November, Meta Platforms (META) shares have shown bearish momentum following the company’s quarterly report, which included a one-off income tax expense of $15.93 billion (as previously noted).
Investor concerns have been further fuelled by the
META Pullback or Power Move? Technical Structure Decides🎯 META PLATFORMS INC. (NASDAQ) | THE THIEF'S PROFIT PLAYBOOK 💰
Bullish Swing Trade Setup | Supertrend + Triangular Moving Average Pullback
📊 SETUP OVERVIEW
This analysis presents a disciplined swing trading strategy on META (NASDAQ: Meta Platforms Inc.) leveraging proven technical indicators combin

META – Technical Analysis (15m SMC) Nov 11META is still in a controlled downtrend channel, but you now have a clean sequence of BOS → CHoCH → retest, showing early signs of a shift. Price is coiling under the short-term trendline and getting ready for a breakout decision.
Market Structure
1. BOS (Break of Structure) – Bearish
Multiple BOS

$META, As expected, just lost $600 support level. Update NASDAQ:META
As expected, we just lost $600 support level.
Expect the bulls to try to make a bottom in the $550-$500 zone. If that bottom will hold or fail will depend on the broader market.
My plan is take profits in that zone and move on to the next trade.
Is Meta Share Price About To Get Better?Meta hasn’t been kind to the bulls in recent weeks, falling around 25% from its August high. However, with bullish price action emerging near a key support cluster, it may finally be time for buyers to step in.
Matt Simpson, Market Analyst at City Index.

META: Next Long Term Buy Following a disappointing earnings report, Meta (META) dropped more than 10% in post-market trading, decisively breaking through several key support levels. My primary support zones are typically derived from anchored VWAPs (Volume-Weighted Average Prices), which help identify where institutional bu

META : Buyers Stepping In After a Sharp Drop!META has shown a strong rejection from the recent lows, suggesting buyers are defending key Zone. If momentum continues, we might see a corrective push up before the next major move. Watch the 640–650 area for signs of exhaustion.
Disclosure: We are part of Trade Nation's Influencer program and rec

See all ideas
Summarizing what the indicators are suggesting.
Neutral
SellBuy
Strong sellStrong buy
Strong sellSellNeutralBuyStrong buy
Neutral
SellBuy
Strong sellStrong buy
Strong sellSellNeutralBuyStrong buy
Neutral
SellBuy
Strong sellStrong buy
Strong sellSellNeutralBuyStrong buy
An aggregate view of professional's ratings.
Neutral
SellBuy
Strong sellStrong buy
Strong sellSellNeutralBuyStrong buy
Neutral
SellBuy
Strong sellStrong buy
Strong sellSellNeutralBuyStrong buy
Neutral
SellBuy
Strong sellStrong buy
Strong sellSellNeutralBuyStrong buy
Displays a symbol's price movements over previous years to identify recurring trends.
US30303M8D7
Meta Platforms, Inc. 3.85% 15-AUG-2032Yield to maturity
14.63%
Maturity date
Aug 15, 2032
FB5868810
Meta Platforms, Inc. 5.55% 15-AUG-2064Yield to maturity
5.92%
Maturity date
Aug 15, 2064
FB6221365
Meta Platforms, Inc. 5.75% 15-NOV-2065Yield to maturity
5.89%
Maturity date
Nov 15, 2065
FB5458295
Meta Platforms, Inc. 4.65% 15-AUG-2062Yield to maturity
5.87%
Maturity date
Aug 15, 2062
FB5581331
Meta Platforms, Inc. 5.75% 15-MAY-2063Yield to maturity
5.87%
Maturity date
May 15, 2063
FB5522241
Meta Platforms, Inc. 4.65% 15-AUG-2062Yield to maturity
5.82%
Maturity date
Aug 15, 2062
FB5868809
Meta Platforms, Inc. 5.4% 15-AUG-2054Yield to maturity
5.77%
Maturity date
Aug 15, 2054
FB5581330
Meta Platforms, Inc. 5.6% 15-MAY-2053Yield to maturity
5.77%
Maturity date
May 15, 2053
FB6221364
Meta Platforms, Inc. 5.625% 15-NOV-2055Yield to maturity
5.75%
Maturity date
Nov 15, 2055
FB5522214
Meta Platforms, Inc. 4.45% 15-AUG-2052Yield to maturity
5.73%
Maturity date
Aug 15, 2052
FB6221369
Meta Platforms, Inc. 5.5% 15-NOV-2045Yield to maturity
5.60%
Maturity date
Nov 15, 2045
See all META bonds
Curated watchlists where META is featured.


Frequently Asked Questions
The current price of META is 2,285,000 COP — it has increased by 0.31% in the past 24 hours. Watch Meta Platforms Inc Class A stock price performance more closely on the chart.
Depending on the exchange, the stock ticker may vary. For instance, on BVC exchange Meta Platforms Inc Class A stocks are traded under the ticker META.
META stock has fallen by −1.96% compared to the previous week, the month change is a −18.34% fall, over the last year Meta Platforms Inc Class A has showed a −11.43% decrease.
We've gathered analysts' opinions on Meta Platforms Inc Class A future price: according to them, META price has a max estimate of 4,231,060.61 COP and a min estimate of 2,121,212.12 COP. Watch META chart and read a more detailed Meta Platforms Inc Class A stock forecast: see what analysts think of Meta Platforms Inc Class A and suggest that you do with its stocks.
META reached its all-time high on Jul 31, 2025 with the price of 3,280,000 COP, and its all-time low was 2,062,640 COP and was reached on Apr 21, 2025. View more price dynamics on META chart.
See other stocks reaching their highest and lowest prices.
See other stocks reaching their highest and lowest prices.
META stock is 2.07% volatile and has beta coefficient of 1.43. Track Meta Platforms Inc Class A stock price on the chart and check out the list of the most volatile stocks — is Meta Platforms Inc Class A there?
Today Meta Platforms Inc Class A has the market capitalization of 5,775.87 T, it has decreased by −3.79% over the last week.
Yes, you can track Meta Platforms Inc Class A financials in yearly and quarterly reports right on TradingView.
Meta Platforms Inc Class A is going to release the next earnings report on Feb 4, 2026. Keep track of upcoming events with our Earnings Calendar.
META earnings for the last quarter are 4.12 K COP per share, whereas the estimation was 26.36 K COP resulting in a −84.38% surprise. The estimated earnings for the next quarter are 30.84 K COP per share. See more details about Meta Platforms Inc Class A earnings.
Meta Platforms Inc Class A revenue for the last quarter amounts to 200.95 T COP, despite the estimated figure of 194.15 T COP. In the next quarter, revenue is expected to reach 219.27 T COP.
META net income for the last quarter is 10.62 T COP, while the quarter before that showed 74.84 T COP of net income which accounts for −85.81% change. Track more Meta Platforms Inc Class A financial stats to get the full picture.
Yes, META dividends are paid quarterly. The last dividend per share was 2.03 K COP. As of today, Dividend Yield (TTM)% is 0.34%. Tracking Meta Platforms Inc Class A dividends might help you take more informed decisions.
Meta Platforms Inc Class A dividend yield was 0.34% in 2024, and payout ratio reached 8.38%. The year before the numbers were 0.00% and 0.00% correspondingly. See high-dividend stocks and find more opportunities for your portfolio.
As of Nov 16, 2025, the company has 74.07 K employees. See our rating of the largest employees — is Meta Platforms Inc Class A on this list?
EBITDA measures a company's operating performance, its growth signifies an improvement in the efficiency of a company. Meta Platforms Inc Class A EBITDA is 390.82 T COP, and current EBITDA margin is 51.83%. See more stats in Meta Platforms Inc Class A financial statements.
Like other stocks, META shares are traded on stock exchanges, e.g. Nasdaq, Nyse, Euronext, and the easiest way to buy them is through an online stock broker. To do this, you need to open an account and follow a broker's procedures, then start trading. You can trade Meta Platforms Inc Class A stock right from TradingView charts — choose your broker and connect to your account.
Investing in stocks requires a comprehensive research: you should carefully study all the available data, e.g. company's financials, related news, and its technical analysis. So Meta Platforms Inc Class A technincal analysis shows the sell today, and its 1 week rating is strong sell. Since market conditions are prone to changes, it's worth looking a bit further into the future — according to the 1 month rating Meta Platforms Inc Class A stock shows the strong sell signal. See more of Meta Platforms Inc Class A technicals for a more comprehensive analysis.
If you're still not sure, try looking for inspiration in our curated watchlists.
If you're still not sure, try looking for inspiration in our curated watchlists.