NKE 1HR Trend Zones
This analysis is shared strictly for educational purposes and is not financial advice. It is intended to illustrate chart-reading techniques, structure mapping, and scenario planning.
UP TREND (marked in yellow/orange)
A horizontal dotted line above the central region highlights where
Next report date
—
Report period
—
EPS estimate
—
Revenue estimate
—
1.95 USD
3.22 B USD
46.40 B USD
1.17 B
About Nike, Inc.
Sector
Industry
CEO
Elliott J. Hill
Website
Headquarters
Beaverton
Founded
1964
ISIN
US6541061031
FIGI
BBG00YFGCST7
NIKE, Inc engages in the design, development, marketing, and sale of athletic footwear, apparel, accessories, equipment, and services. It operates through the following segments: North America; Europe, Middle East & Africa; Greater China; Asia Pacific & Latin America; Global Brand Divisions; Converse; and Corporate. The North America; Europe, Middle East & Africa; Greater China; and Asia Pacific & Latin America segments refers to the design, development, marketing, and selling of athletic footwear, apparel, and equipment. The Global Brand Divisions represents NIKE Brand licensing businesses. The Converse segment designs, markets, licenses, and sells casual sneakers, apparel, and accessories. The Corporate segment consists of unallocated general and administrative expenses. The company was founded by William Jay Bowerman and Philip H. Knight on January 25, 1964 and is headquartered in Beaverton, OR.
Related stocks

NKE – Swing/PositionNike is a globally recognised brand with strong distribution, and at current price levels (~$62.50) it offers a potential low-risk entry into a long-term leader in footwear/apparel. The staggered entry zones allow you to build a position as price consolidates or corrects. Pull-backs to $58 or $53 of

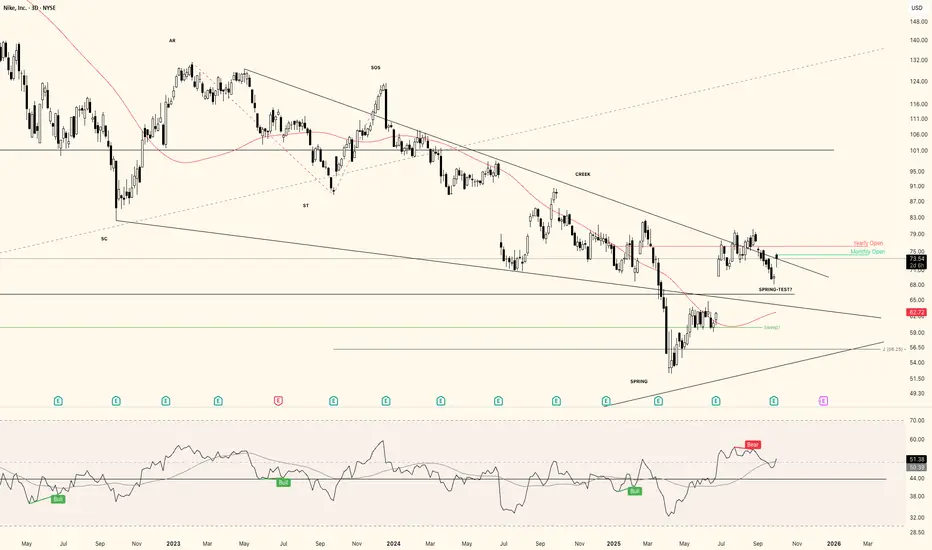
NKE starting a new uprendIf you've followed my previous post about NYSE:NKE you know I was eying a descending wyckoff accumulation schematic. We successfully anticipated the spring-phase and now I think there is a big chance the spring-test has been completed, or anyway will complete soon.
So long story short: next up is
NKE may be ready to jump big timeFrom a technical standpoint, it’s important to note that we appear to have completed a multi-year correction, followed by a solid relief rally and a subsequent pullback to the 61.8% Fibonacci retracement level. This is the basis of my technical stance.
My fundamental analysis of NIKE, though, revea

December 2025 is Hurst's 9 Years Cycle!Margin of Error "Adjusted" on the chart:
9 Years, 4.5 Years and 18 Months !
1: September 2025 is our early trough
2: 2027 is our late trough
3: Or we are having one right now !

Nike by April 2025 we should have break out or breakdown !101 Trend lines analysis. By April we should could/might reach the Red line in which we will have a break out to a new ATH in the next years or so or a break down to the 40ish/50ish region.!

Nike is reaching trough lands soon ! Or not & W crash more !61% Retracement from all time low "IPO" to "ATH" is in the 60ish region. MKTS permitting & unless we are about to crash just like 1929 as some Elliottsions suggest then we are about to have a trough in Q1/Q2 of 2025 .!

Nike's 1984 Vs 2000 Major Trend lines The 1984 Major and historical Trend line is already broken with 3 candles below, technially
this is a valid and confirmed breakdown.
The 2000 Major and historical Trend line is hanging by $5 give or take $66 -+ is the support for the TL.

NKE Longdemand Zone
Long entry 61.5
Stop 58,
Target 70, 80
Risk management is much more important than a good entry point.
I am not a PRO trader.
In my trading plan, the Max Risk of each short term trade should be less than 1% of an account.

Nike Isn’t Flying AnymoreNike was once an unstoppable consumer giant. However, with its last all-time high four years in the rearview mirror, some traders may see downside risk.
The first pattern on today’s chart is the June 11 high of $64.85. NKE bounced above that level on October 10 but ended the month slightly below it

See all ideas
Summarizing what the indicators are suggesting.
Neutral
SellBuy
Strong sellStrong buy
Strong sellSellNeutralBuyStrong buy
Neutral
SellBuy
Strong sellStrong buy
Strong sellSellNeutralBuyStrong buy
Neutral
SellBuy
Strong sellStrong buy
Strong sellSellNeutralBuyStrong buy
An aggregate view of professional's ratings.
Neutral
SellBuy
Strong sellStrong buy
Strong sellSellNeutralBuyStrong buy
Neutral
SellBuy
Strong sellStrong buy
Strong sellSellNeutralBuyStrong buy
Neutral
SellBuy
Strong sellStrong buy
Strong sellSellNeutralBuyStrong buy
Displays a symbol's price movements over previous years to identify recurring trends.
US654106AG8
NIKE, Inc. 3.375% 01-NOV-2046Yield to maturity
5.53%
Maturity date
Nov 1, 2046
NKEB
NIKE, Inc. 3.875% 01-NOV-2045Yield to maturity
5.52%
Maturity date
Nov 1, 2045
NKE4971170
NIKE, Inc. 3.375% 27-MAR-2050Yield to maturity
5.49%
Maturity date
Mar 27, 2050
NKEA
NIKE, Inc. 3.625% 01-MAY-2043Yield to maturity
5.45%
Maturity date
May 1, 2043
NKE4971169
NIKE, Inc. 3.25% 27-MAR-2040Yield to maturity
5.05%
Maturity date
Mar 27, 2040
US654106AF0
NIKE, Inc. 2.375% 01-NOV-2026Yield to maturity
4.02%
Maturity date
Nov 1, 2026
NKE4971167
NIKE, Inc. 2.75% 27-MAR-2027Yield to maturity
3.85%
Maturity date
Mar 27, 2027
NKE4971168
NIKE, Inc. 2.85% 27-MAR-2030Yield to maturity
3.81%
Maturity date
Mar 27, 2030
See all NKE bonds
Curated watchlists where NKE is featured.


Frequently Asked Questions
The current price of NKE is 62.10 USD — it has increased by 1.89% in the past 24 hours. Watch NIKE, Inc. Class B stock price performance more closely on the chart.
Depending on the exchange, the stock ticker may vary. For instance, on BVL exchange NIKE, Inc. Class B stocks are traded under the ticker NKE.
NKE stock has risen by 1.89% compared to the previous week, the month change is a −7.31% fall, over the last year NIKE, Inc. Class B has showed a −18.15% decrease.
We've gathered analysts' opinions on NIKE, Inc. Class B future price: according to them, NKE price has a max estimate of 120.00 USD and a min estimate of 38.00 USD. Watch NKE chart and read a more detailed NIKE, Inc. Class B stock forecast: see what analysts think of NIKE, Inc. Class B and suggest that you do with its stocks.
NKE stock is 1.85% volatile and has beta coefficient of 1.13. Track NIKE, Inc. Class B stock price on the chart and check out the list of the most volatile stocks — is NIKE, Inc. Class B there?
Today NIKE, Inc. Class B has the market capitalization of 92.37 B, it has increased by 8.09% over the last week.
Yes, you can track NIKE, Inc. Class B financials in yearly and quarterly reports right on TradingView.
NIKE, Inc. Class B is going to release the next earnings report on Dec 18, 2025. Keep track of upcoming events with our Earnings Calendar.
NKE earnings for the last quarter are 0.49 USD per share, whereas the estimation was 0.27 USD resulting in a 80.12% surprise. The estimated earnings for the next quarter are 0.37 USD per share. See more details about NIKE, Inc. Class B earnings.
NIKE, Inc. Class B revenue for the last quarter amounts to 11.72 B USD, despite the estimated figure of 10.99 B USD. In the next quarter, revenue is expected to reach 12.21 B USD.
NKE net income for the last quarter is 727.00 M USD, while the quarter before that showed 211.00 M USD of net income which accounts for 244.55% change. Track more NIKE, Inc. Class B financial stats to get the full picture.
Yes, NKE dividends are paid quarterly. The last dividend per share was 0.40 USD. As of today, Dividend Yield (TTM)% is 2.56%. Tracking NIKE, Inc. Class B dividends might help you take more informed decisions.
NIKE, Inc. Class B dividend yield was 2.59% in 2024, and payout ratio reached 72.55%. The year before the numbers were 1.53% and 38.91% correspondingly. See high-dividend stocks and find more opportunities for your portfolio.
As of Nov 19, 2025, the company has 77.8 K employees. See our rating of the largest employees — is NIKE, Inc. Class B on this list?
EBITDA measures a company's operating performance, its growth signifies an improvement in the efficiency of a company. NIKE, Inc. Class B EBITDA is 4.00 B USD, and current EBITDA margin is 9.21%. See more stats in NIKE, Inc. Class B financial statements.
Like other stocks, NKE shares are traded on stock exchanges, e.g. Nasdaq, Nyse, Euronext, and the easiest way to buy them is through an online stock broker. To do this, you need to open an account and follow a broker's procedures, then start trading. You can trade NIKE, Inc. Class B stock right from TradingView charts — choose your broker and connect to your account.
Investing in stocks requires a comprehensive research: you should carefully study all the available data, e.g. company's financials, related news, and its technical analysis. So NIKE, Inc. Class B technincal analysis shows the sell today, and its 1 week rating is sell. Since market conditions are prone to changes, it's worth looking a bit further into the future — according to the 1 month rating NIKE, Inc. Class B stock shows the sell signal. See more of NIKE, Inc. Class B technicals for a more comprehensive analysis.
If you're still not sure, try looking for inspiration in our curated watchlists.
If you're still not sure, try looking for inspiration in our curated watchlists.