JAW trade ideas


Head and Shoulder on JBLU playing outThis head and shoulder on Jetblue is playing out nicely. Target is 11.

Jet Blue / On Downtrend looking for supportJet Blue is on a big downtrend. We are showing some RSI divergence in the last days, but only support on the map is the 16.28 / Fibo 0.682.
Will see how it goes.


JBLU Bullish OpportunityPE = 10.44 ; Forward PE = 8.15 (GOOD)
EP/S (t.t.m) = 1.97 ; EP/S Next Year = 2.52 (GOOD)
Book/sh = 10.04
Target Price $27


JBLU & USDCAD - Long to 26JBLU has shown a strong correlation with USDCAD, as both financial instruments are inversely correlated with oil (shown below). It should also be noted that USDCAD has recently broken out of a cup and handle pattern on the monthly chart and a continued rise could be an early indication of similar price action in the aerospace sector. The wave count for USDCAD suggests that an extended fifth may be in progress, which if true would provide a confluent fifth wave target. JBLU targets may be placed at 26 and 30, extensions of wave ((3)). These extensions proved to be important in sub-degree 5th wave targets and the fractal characteristic of EW suggests that these levels may also play an important role on the larger degree. A SL may be placed below wave (1) high at around 21.40.
Correlation with USDCAD:
USDCAD Monthly Cup and Handle:
USDCAD Wave Count:

Sell Short JetBlue (JBLU) compared to Buy Southwest (LUV)The ratio of LUV/JBLU is turning up after a long slide of 50% from 3.00 down to 1.50 where it is breaking a 5+ month downtrend in the past two days.
If you look at the pure price chart overlay of the two stocks, they oscillate back and forth over time and looking back one year (in this chart) you can see that LUV is lagging a bit lately and JBLU is ahead of itself.
I am looking at putting on both of these positions: Short JBLU to fall relative to LUV. And Long LUV to rally relative to JBLU.
Risk 3% to make 10% over the next 10-15 days.
Tim 1:48PM EST Friday, July 24, 2015

JBLU shortA 5 wave formation has finished, I suspect an ABC pull back to somewhere around the 38.2% fib retracement. Risking only .67 on the trade, with a 2.84 target or 14.01%.

JBLU LONG lots of support Stochastic s turning up JBLUE is holding this Trend-line support watch the levels 19.50-20 buy zones. The airlines are all hitting the buy levels. I cant stress enough, traders must learn to BUY the FEAR and SELL the GREED. Always have a plan and always have a stop. understand your parameters and you will do well.
KEEP IT SIMPLE TRADE LEVELS

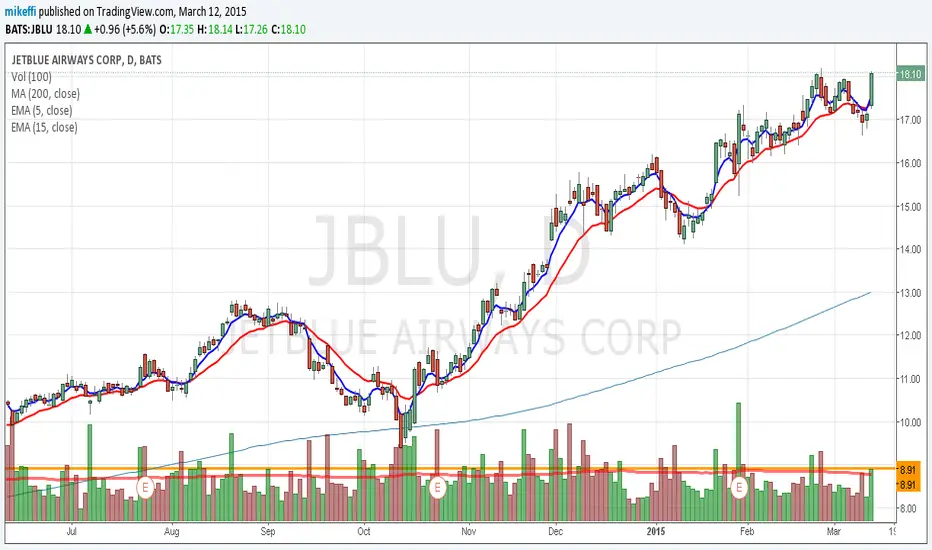
JBLU further to fly?Further up-move on average volume and new highs may provide further upside in this out-performer in the sector, Would need confirmation of further move higher in last hour despite the lofty heights price seems to continue to hit,

JBLU ready to fly againRe-test of $18 high on strong trading volume. good options yields for weekly position may suit ITM call spread or weekly covered call
JBLU DailyWolfe Waves and cross current Channels.
Triple Top. Rejection bar. 1/2-diamond formation.
Under 20 sma.
MACD triple top. CrossOver.
RSI bearish divergence.
Target_1 : 11.97
Target_2 : 11.44

Triangle within a triangle (Bearish Pattern)Price ahead of the earning skyrocketed today, and it scared recent short sellers but will it last is the question? There were two bearish signals lately both bearish triangle but today's price action seems nullifying both of them. Trading is a tough business, and u need to do more than viewing chart. Recent long swing upside achieved its target, the bearish harami failed but for scalp trading proved to be Strong signal (1-5 days) the large bearish triangle may finally prove right. The stdev stands as of today 1.97 and the stock is up 69% from July last year. Now, no position but may start one at $12 and above. If you like this follow us


PAIRS TRADE: JetBlue JBLU buy vs Delta DAL and SthWst Air LUVThis is a starting point for looking at this trade setup.
Delta DAL and Southwest LUV have a massive performance spread over JetBlue JBLU that, if closed, would yield a substantial profit.
I like the JBLU chart because it has the appearance of having a top or "head and shoulders" pattern to make technical traders jump all over it. It had a recent breakdown which gave it the look that it would break-down but what appears to be the case is that the stock is actually accumulating and if it can climb just a little further it could squeeze out any shorts in a fast rally to a breakout.
What I can see here is that money is likely coming off the table in LUV and DAL and those stocks could come under pressure as investors cash out and move to other stocks in the group that offer more value.
Risk 5%, Reward 10%-15% in one month. Measure the pure price spread between these securities.
JBLU vs DAL
JBLU vs LUV
Tim 11:08AM EST 3/25/2014 JBLU 8.63 last +0.10


JBLU isn't donePossible bull flag formation on JBLU. Been holding the gap around $8.70 very well. Ichimoku still looks bullish
